ARINC
Decoder. V4.7
|
ARINC
Decoder. V4.7
|
|
License
/ Installation |
Aeronautical information... reliable, accurate, complete, and just a click away!
|
This software allows to read datasets
encoded in ARINC 424-18 (compatible 16 to 19), generally provided by FMS databases
coders or by some states (USA with free FAA CIFP = coded Instrument Flight Procedures).
The file contains all global aeronautical information of the world, it is updated
each AIRAC cycle, every 28 days.
This software can make it readable and understandable parts of lines of code
and view them on a map or with google earth.
This program runs from the main screen,
the add-ons are available thanks to the button bar: ![]()
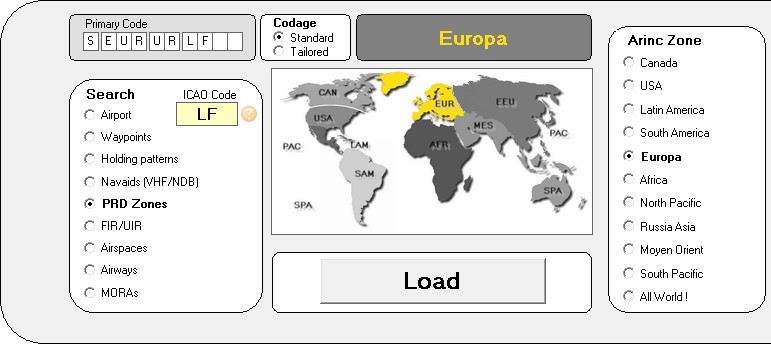
Due to the large number of rows in the database file (more than 2 millions), all research should be conducted in three steps.
1)
select the object of research 
2)
Select the geographical area on the map 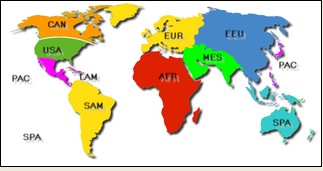 or in the list
Nota: This step can be avoided if you enter an ICAO code in the area
![]()
The selection of the area will be done automatically by area code of your search.
To do a global search, you have
the ultimate solution "All World !" .
It has a fatal flaw: to slow the process because the entire file is then systematically
covered.
3)
Press the ![]() button
button
This will put in the memory all the datas of the query.
If you do a search on an airport,
you can tell, instead of its ICAO code its IATA code (3 letters), by clicking
the label "Code OACI" the box below turns green. ![]() Enter your IATA code, eg:
Enter your IATA code, eg: ![]() and
press enter (or click on "Search"). The ICAO code will appear automatically
and
press enter (or click on "Search"). The ICAO code will appear automatically
![]() and research will
normally be made.
and research will
normally be made.
To avoid having too many elements you can specify output 1, 2, 3 or 4 characters
in the field ![]() or by making a selection on the right, which will be dependent on the first
query.
or by making a selection on the right, which will be dependent on the first
query.
Example, for Zodans, you can ask "Prohibited" only, or "danger", etc..
- Search for airports, you can just
ask the runways, or just terminal waypoints, etc.. Then you will have a list
of clickable elements.
If you want to see something else, make another selection in the bottom right
and press the button 
Until it is not modified, the primary research is kept in memory and has not to be redone.
By the way we just see, we will simply type VVTS in ICAO textbox, or SGN then press the key "enter"
- One or more airports
- take off paths
- The markers
- The ILS
- The Communication parameters (radio)
- The MSAs (Minimum safety altitudes)
- Waypoints terminals
- Parking stands
- The procedures SID (Standard International Departures)
- The procedures Stars (Standard Arrivals)
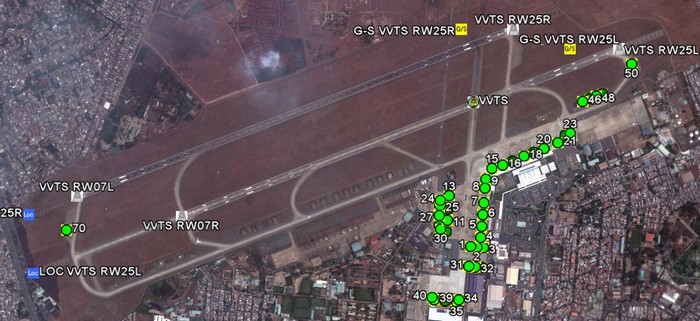
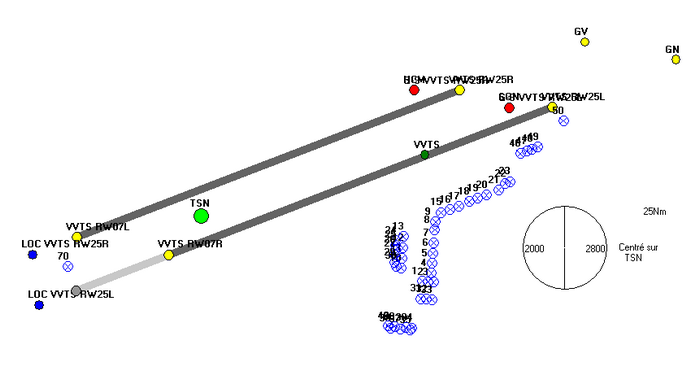
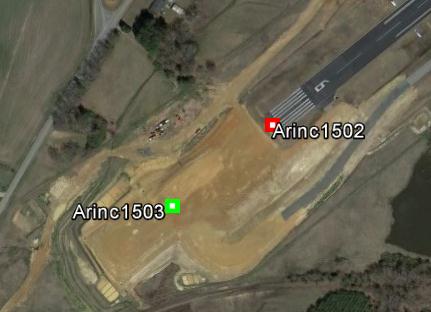
- The procedures approaches.Example, Ho Chi Minh City SGN (VVTs) the positions of the ILS (LOC and GS antennas) , the airport reference point, parking points, runways thresholds:
On Google Earth, or on the map:
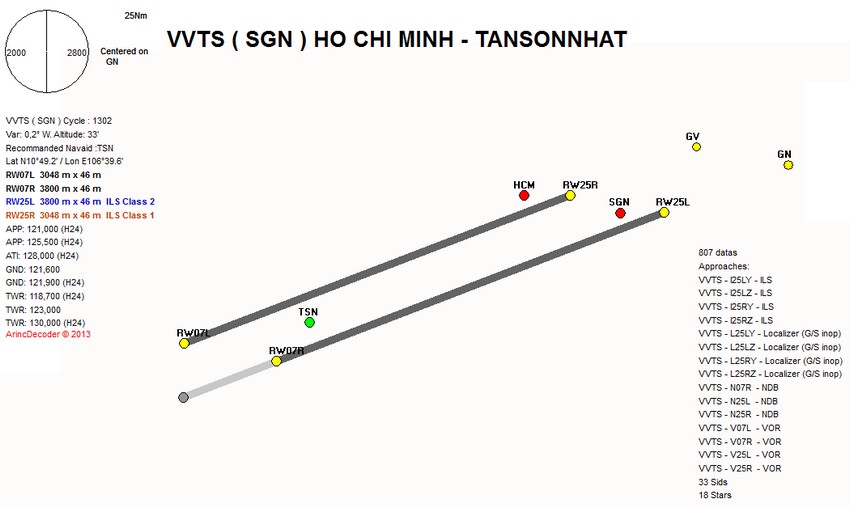
The information displayed at the bottom according to the search item gives clear information stored in the database:
(Example:
)
where we see that SGN is IFR, the longest runway is 3,780 meters long, it is more than 2000m (if not the display is red) and various items that are self explanory... The button "Summary" will generate an image of the field.
All essential information in one page.
(Note the light gray portion of the runway corresponds to the displaced threshold, usable for takeoff but not for landing).
Click in the box "Update"provide updates as Shown here.
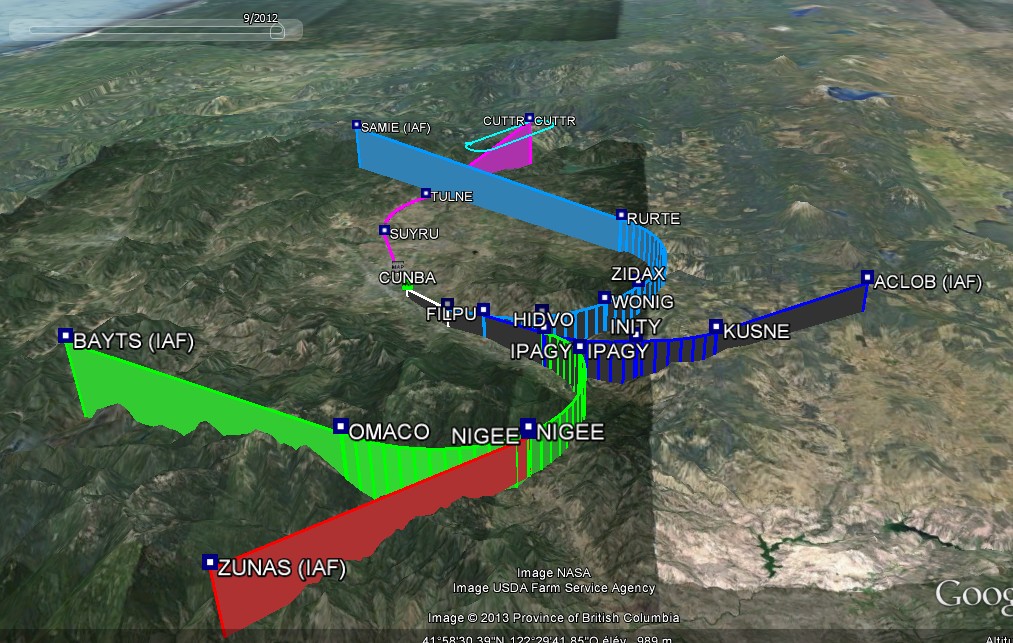
Visualization of the procedure:
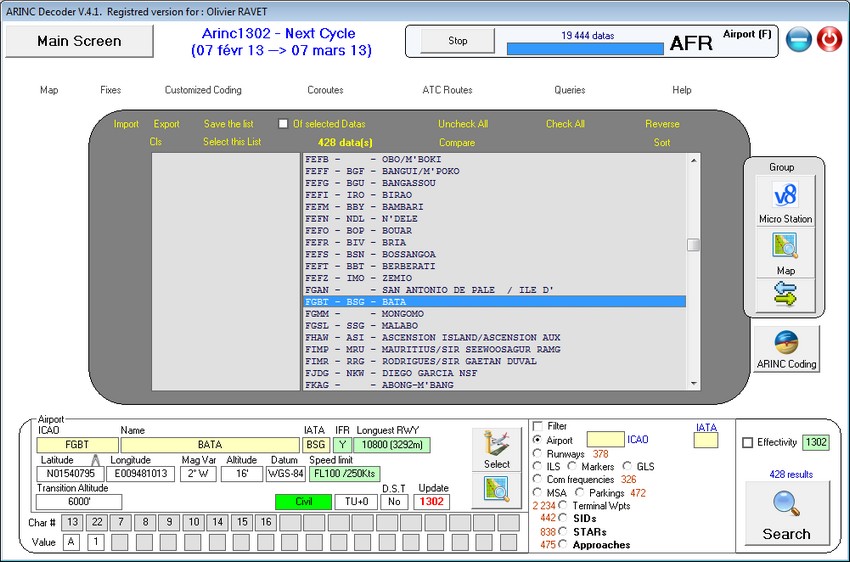
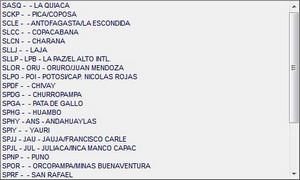
Example: Show me all the fields in Africa in the area beginning with "F" (South Africa, roughly), we have just seen how.
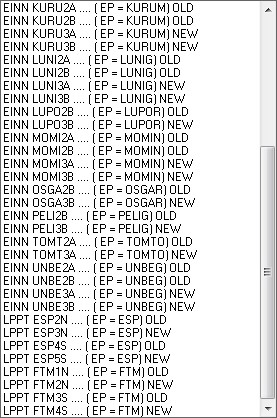
The list gives me 428 airports, Code ICAO, IATA, and the name of the field.
As usual you can view all in the selected viewer or exported in a mapping software.
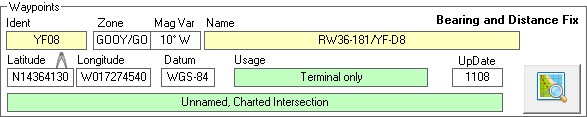
For a field we have the basic information:
Bata here is IFR, the longest runway is 3292 meters, magnetic variation, reference geoid, etc.
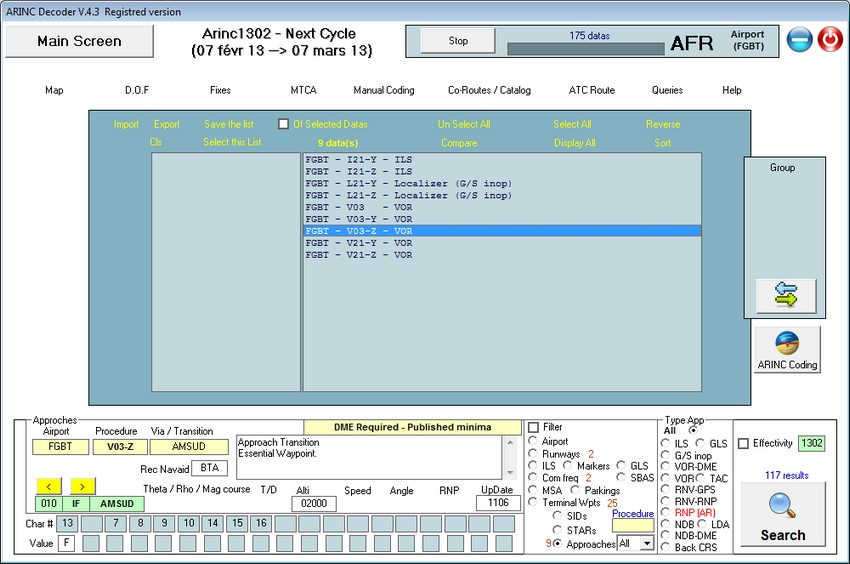
The "Select" button will limit the content of any research on this field alone, to save time, after.(The only selection approaches will emerge that approaches to this field. This will speed up and facilitate the search then ...)
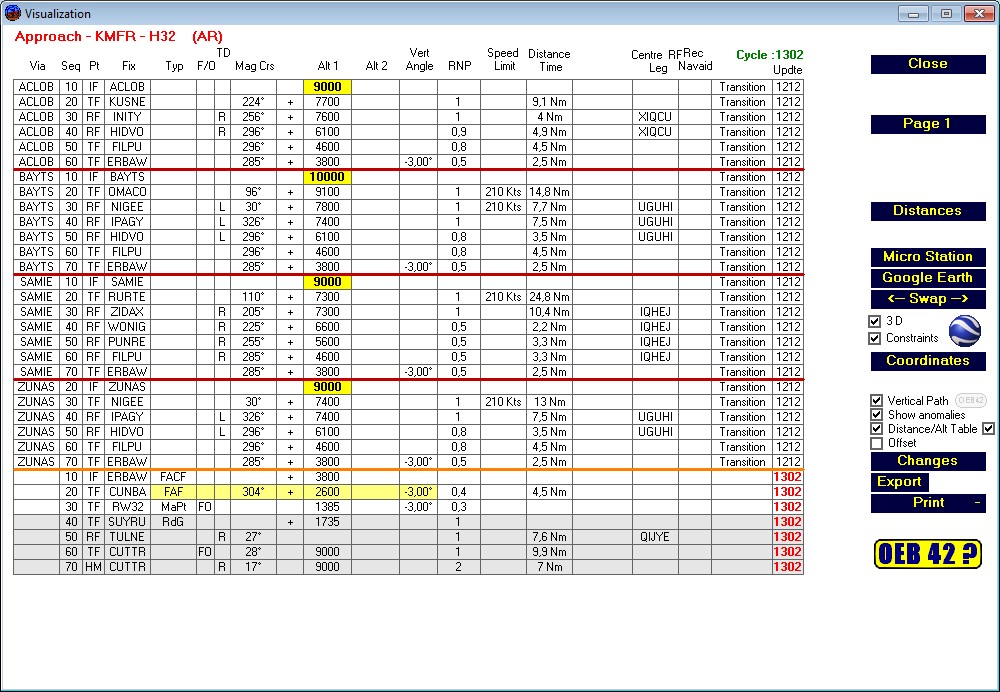
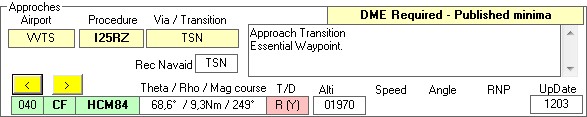
Select the desired approach display this page:
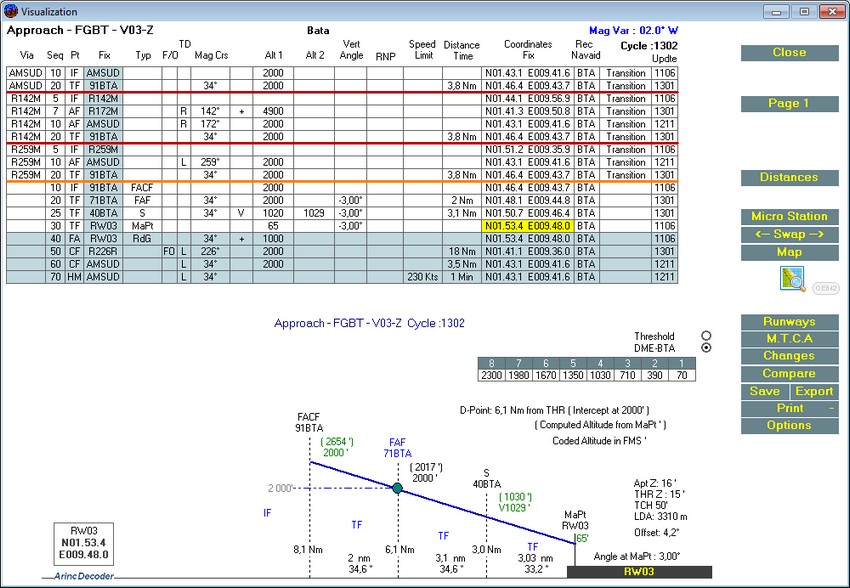
with all the features and coding points.
You'll have here the complete description of the controls of this module.
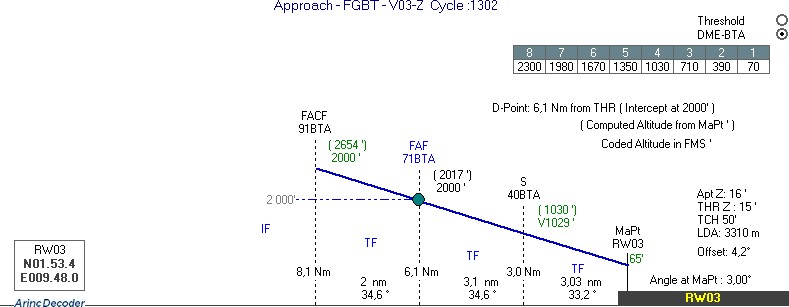
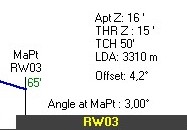
- As indicated in the drawing, elevations in parentheses are the altitudes of passages calculated by distance and in terms of Mapt coded.
Altitudes without parentheses are those coded in database.
If the FAF there is over 150 'of difference between these two altitudes, the display turns red to denounce the anomaly ... based on FMS aircraft will react in different ways and uncertain ...- Similarly, if the offset (off course between the runway and the final segment) exceeds 10°, it is written in red not neglect to warn the crew.
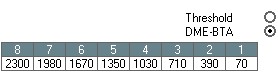
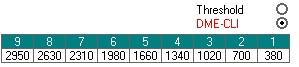
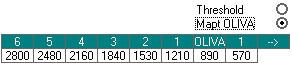
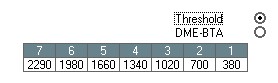
The table and descent profile shows by default. Depending of the type of approach the distance is relative to the THR or to the DME of the Navaid of the procedure. However, when you have a dme you can select this table from the threshold. Here at Bata:
In DME from BTA:
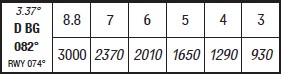
or in Nm from Thr:
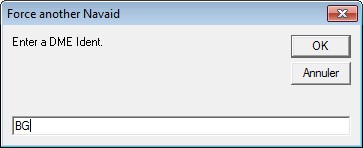
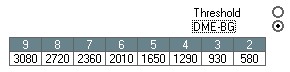
You can change the DME ident by double clicking in it... But it has to be an existing DME near the airport.
If the distance information is in red it's because the information in not reliable, for any reasons (not strait in, no consistent angle, or other)
In this case, considere it with maximum caution.Sometime, in general for an ILS DME the DME is "biased" this mean that the distance indicated is not the real distance between antennas. (The DME is on the Localizer antenna, at the end of the runway, and at the threshold the indication should be "0.0 nm") in this case the DME indicator is red and its tooltiptext gives the Bias (example at Calvi runway 18:)
If the Mapt is not at threshold, and there's no DME in the procedure, you'll have the Mapt in place of the DME: Example FSIA RNAV 13Y:
This function can be deactivated, with the left checkbox "Distance / Altitude Table" unchecked.
By the way the results are normally rounded to the nearest 10 feet. But with the right checkbox you can deactivated that...
Rounded....
not rounded:

- When the Mapt is at the runway threshold, the runway is drawn.
- When the path is coded between two points, the line is thicker. One can deselect the INA (transitions, or via) by clicking in a box on the left, a button appears to rebuild the table with just the arrival of interest. And you can, of course, export the procedure:
Waypoints are
Flyover waypoints:
The FAF:
The Mapt:
A holding pattern:In different colors INA (transitions), the final track in white and in gray the missed approach path.
The principle is the same for a SID or STAR.
The aquisition courses (FC codes, CI, CF, etc..) Are marked by thin lines and gray (dotted line in the internal viewer)
Lines of code "FA" are green and the reference point is recalled.
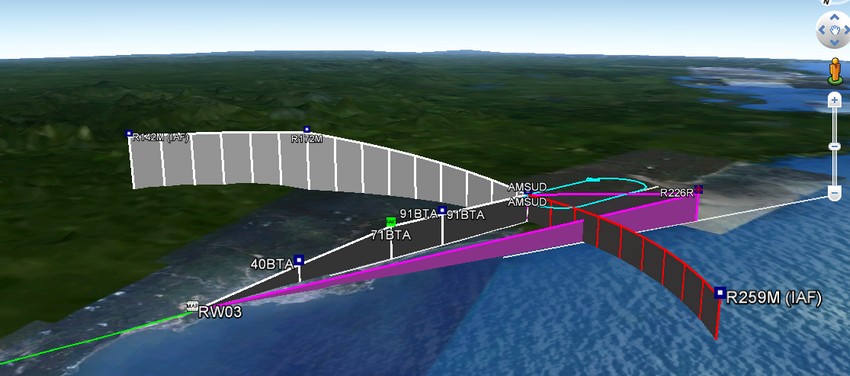
By clicking in the "3D" the procedure will be exported with the altitude information, then Google earth will display the altitude crossing points.
You can double click on the boxes "Alt1" for each line and change the elevation or the information, so that the trajectory remains over the landscape and conform to reality.
Example, in the mountains of Medford (KMFR):
On the main screen the yellow buttons
to navigate between the lines to read their characteristics.
In this window, click in the box "Update"It will be the same principle for a STAR, or a SID.
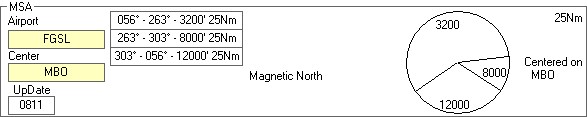
MSA:
Minimum Safety (or sector) Altitude, example, at Malabo...
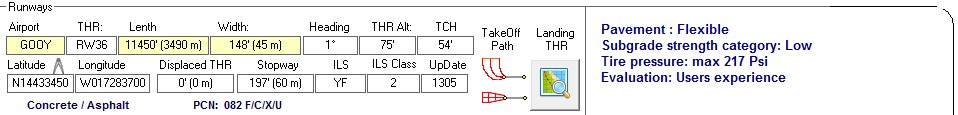
Right-click on the image on the copy to the clipboard for later use.Runways:
The 36 in Dakar:
The buttons "Take Off Path" will launch the module take off paths for this runway and its QFU.
If the display is on the internal viewer, select the two opposed QFUs (or nothing to select all the qfus) and the runway will be drawn. In light gray we'll have the displaced threshold.The PCN is indicated and if we have the information, the gradient of the runway is indicated on the line below.
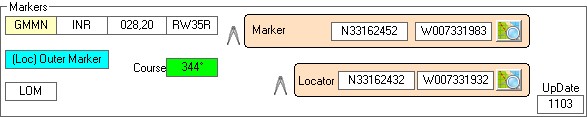
Markers:
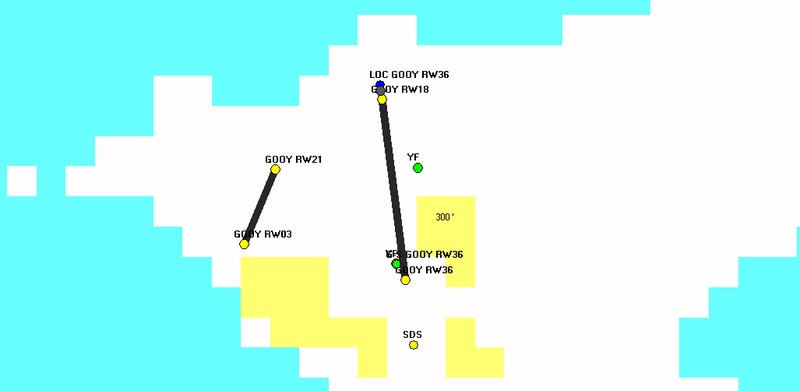
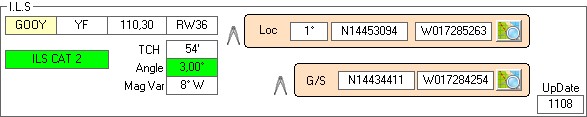
ILS:
Buttons can display independently localizers and glide slope antenna.
Also in Dakar ...
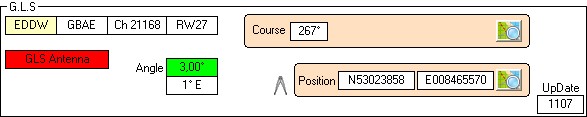
GLS:
The Antenna, If there's any...
SBAS LPV approache Path Point.
For an Egnos or SBAS approach, when the station is coded...
The position is coded with 2 characters more, so Latitude or Longitude is with a 1/10000 of second precision, less than the millimiter.
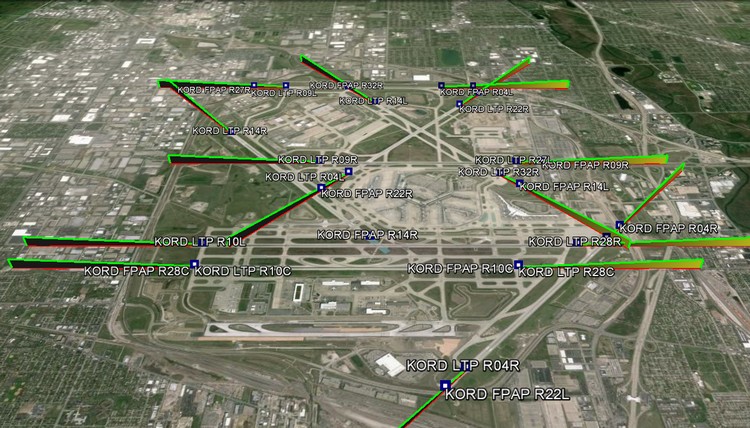
One can plot the final track, the LTP/FTP point and the FPAP for alignment.
HAL = Horizontal Alert / VAL is Vertical Alert / TCH can be expressed in meters or feet.One can plot the fixes or the paths...
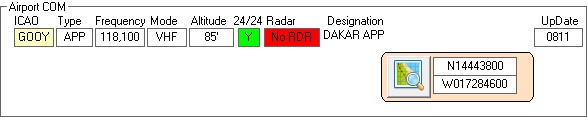
Radio Comm:
24/24 Y or N, and presence or absence of a radar guidance.
Terminal waypoints:
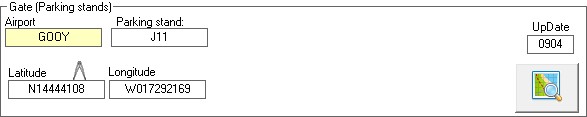
Parking Stands:
Each time, the click in the "Update" provide updates as
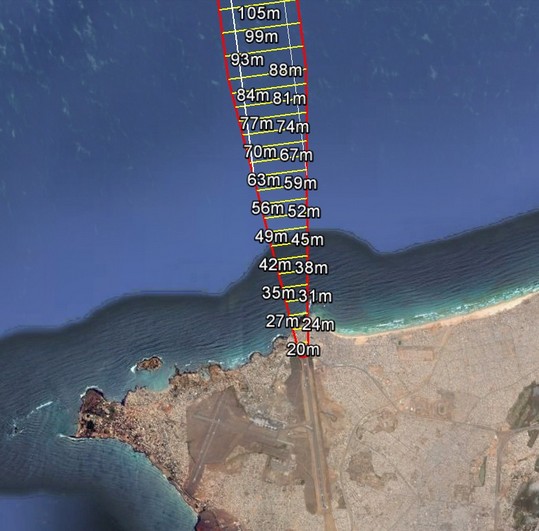
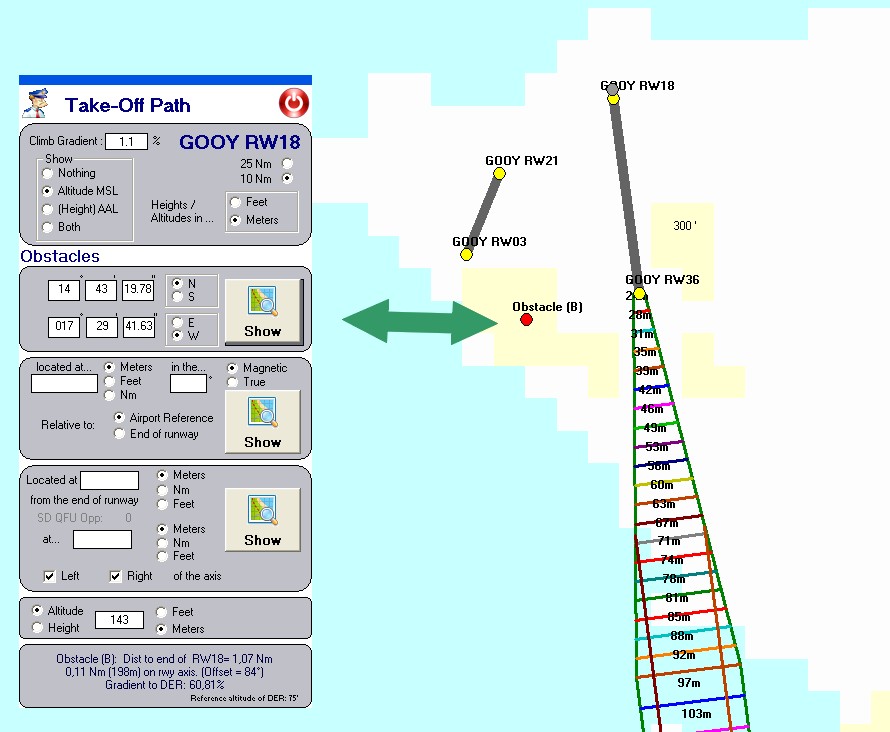
Since the information of a runway (a QFU, exactly) you can quickly determine if an obstacle newly declared in the take off path is to take in account or not.
Using rule (Dx0.125) + 90 m.
The 2 option buttons on top display area on your map based on the selections made. 10 or 25 Nm
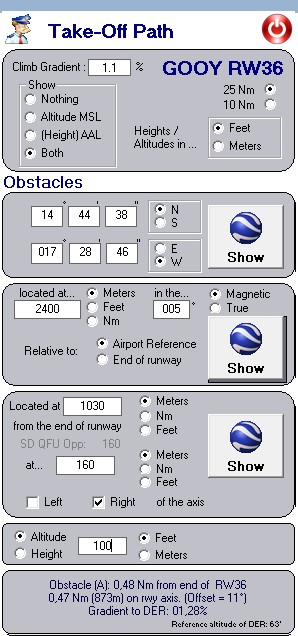
Angle path can be changed, (by default it is 1.1%) to verify the performance with n-1 engine.
You will enter altitudes or heights in meters or feet over the airport elevation or relative to sea level.
- The obstacle to check can then be displayed in 3 different ways, depending on the information received.1) By its geographic coordinates. (Default is the coordinates of the airport, to have fewer digits to change)
2) By a course and a distance relative to the end of the runway or relative to the airport reference point . Example: at 2400 meters from the airport reference point, in the 005° Magnetic
3) By a distance perpendicular to the "runway centerline", right or left of the axis.
Example: same obstacle, 870m after the end of the runway, 160m to the right of the axis:
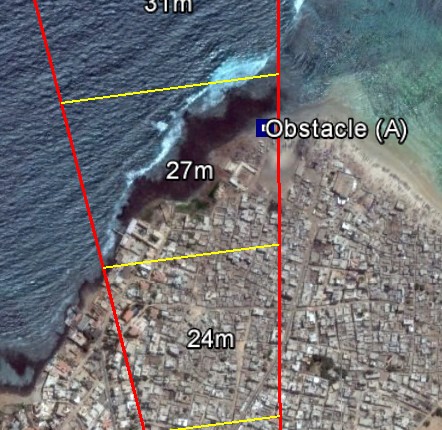
If the top of the obstacle is less than 27 meters high (MSL, in this example) it is outside the take off path.
If the end of the runway has a displaced threshold is considered for the start of the take off path. (Example for 13L in Marseille):
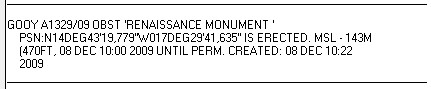
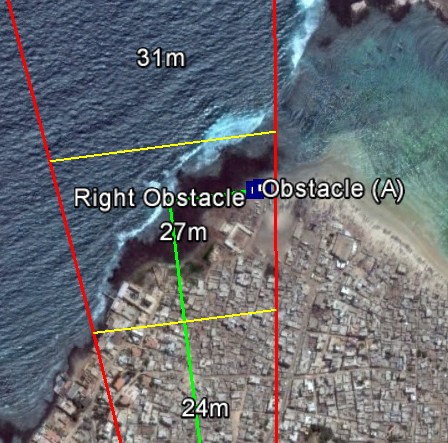
Another example. For dispatchers... Obstacle in take off path ???
You have this Notam...
You open the module with any runway, and you put in the coordinates.... Immediatly you see that the obstacle is far away from any runway.
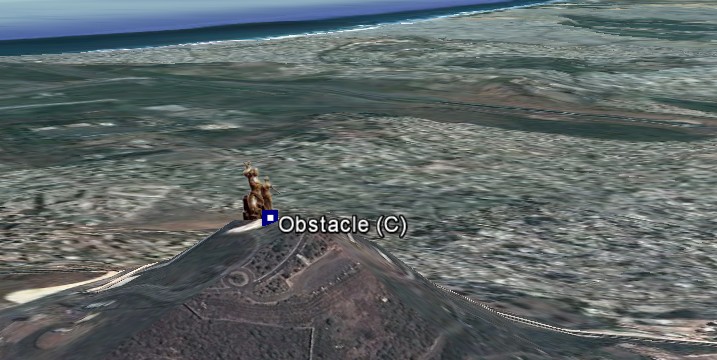
Eventually, if you have google Earth, one can confirm that the obstacle is obviously this one !!!
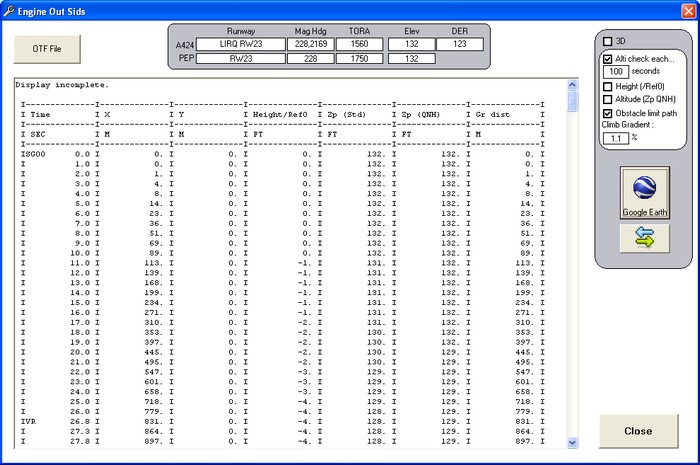
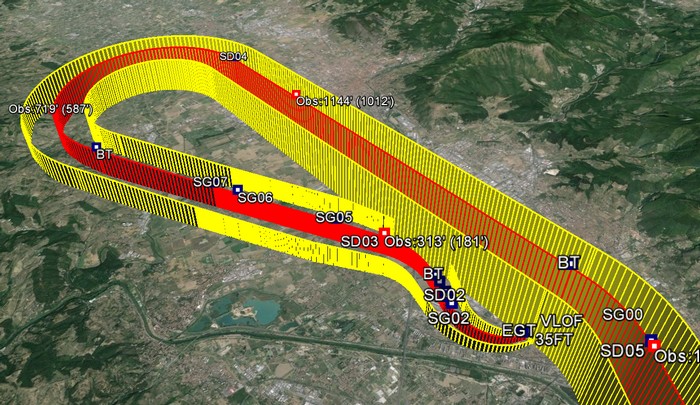
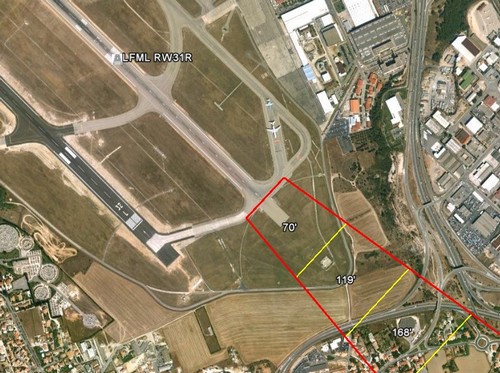
PEP's take off path
When a trajectorie has been computed with Boeing or Airbus (PEP) software you can plot it with ArincDecoder and any obstacle can be checked to confirm it outside of the Takeoff path...
Example at FLR:
You open the OTF file and...
In the U.S.A and in northern America... The DOFs. (Digital Obstacle Files.):
From version 4.1.18 and after you have this button:
And in the internal map, in the "Options" Menu, the option named
shows also the DOF reader module.
A button gives you the way to download the files edited by the FAA. You can put those files wherever you want on your hard disk.
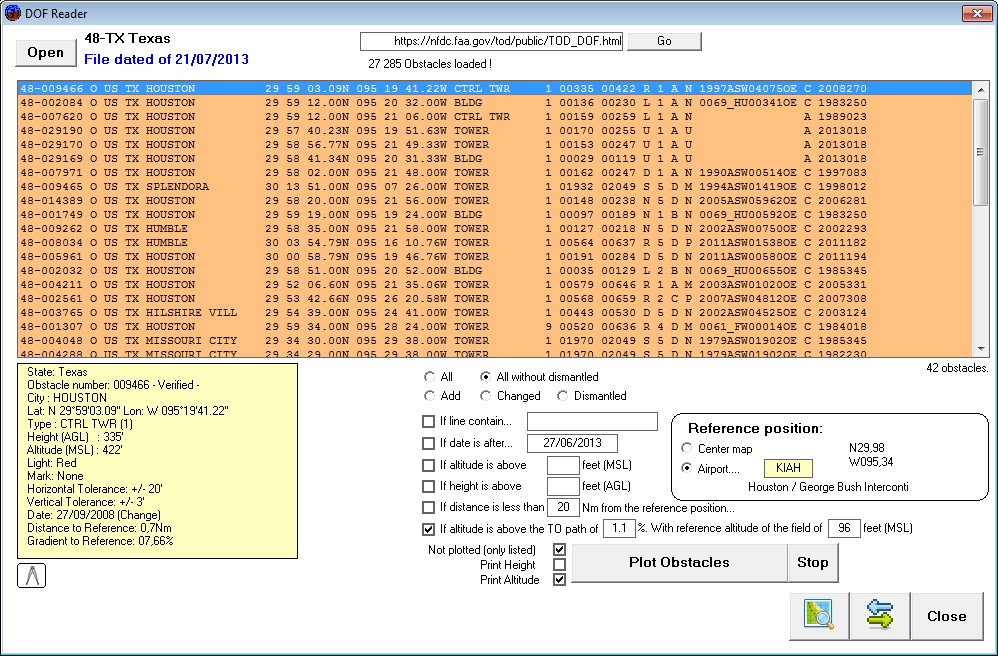
After you open the DOF file (all america) or the file of the country (the state) of your choice.
Here, after Texas opening of july 2013:
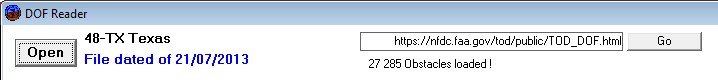
The date of the file will turn red when newer file will be available on their website.
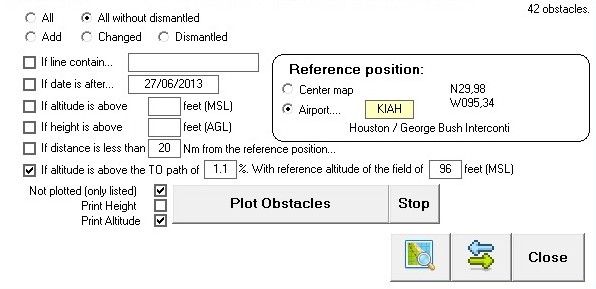
Many choices of extraction of obstacles, by its content, type, etc. by the date of its update, its height or altitude above sea level.
You can display them regarding their their distance from a reference position, that can be the center of the map (internal map) or the reference position of an airport.
One can check again the obstacles in the take off path.
You put ICAO code of the airport, here KIAH, Houston. The reference position is automaticaly known, You enter the gradient of the path to check (by default = 1.1%) and insert the altitude of the field at reference.
Then "Plot Obstacles" and all obstacles that match are listed and/or plotted (on the map or in Google Earth)
They are also listed from the biggest gradient to the smallest one:
On the map, the colors of the points are relative to the height of the obstacle:
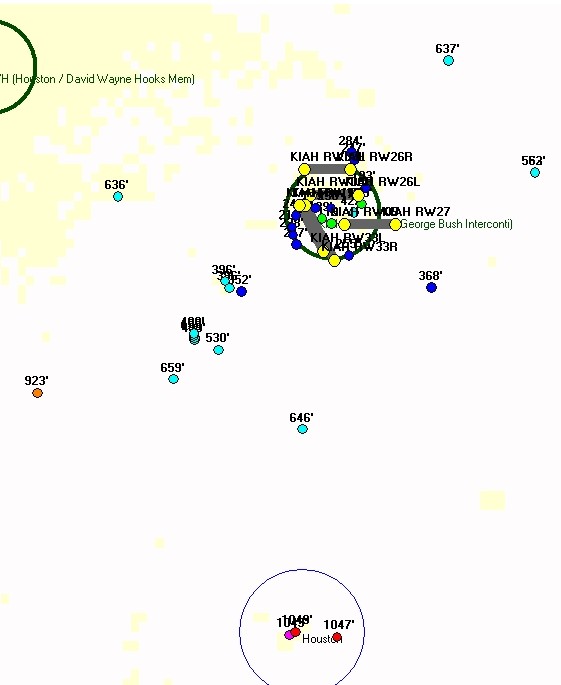
Less than 100 feet: Green
from 100' to 300' : Cyan
from 300' to 600': Blue
from 600' to 900': Orange
from 900' to 1000': magenta
more than 1000': Red.
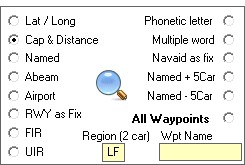 waypoints
"Cap and Distances" only in France (LF)
waypoints
"Cap and Distances" only in France (LF) And in the outgoing list ( 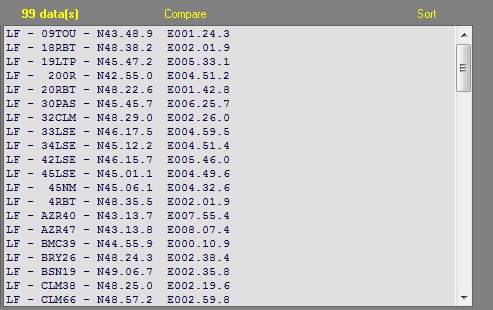 )
Selection displays the desired info ...
)
Selection displays the desired info ...
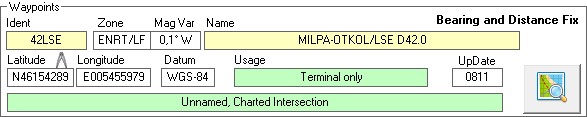
Click in the box "Update" ![]() provide
updates as Shown here.
provide
updates as Shown here.
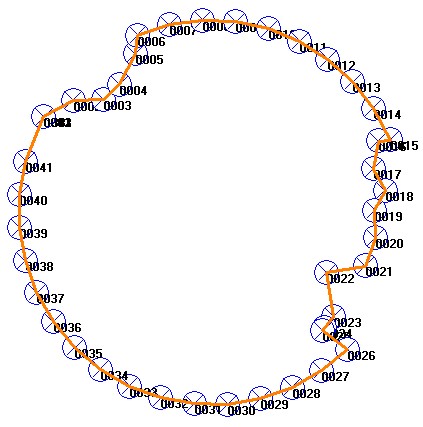
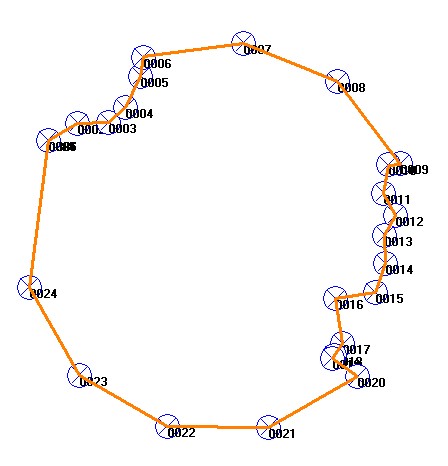
Basic Selection: Holding patterns:
The database contains information of track or Holding patterns.
Example, in Europe Holds that is
beginning with "BI"
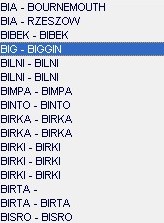
Shows us the famous timewaster -BIG- if any:
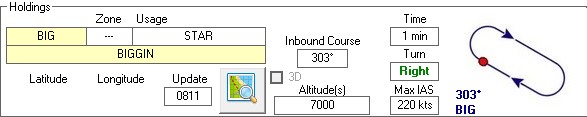
Note that a right click in the image
of the racecourse, this one is copied to the clipboard.
Click in the box "Update" ![]() provide
updates as Shown here.
provide
updates as Shown here.
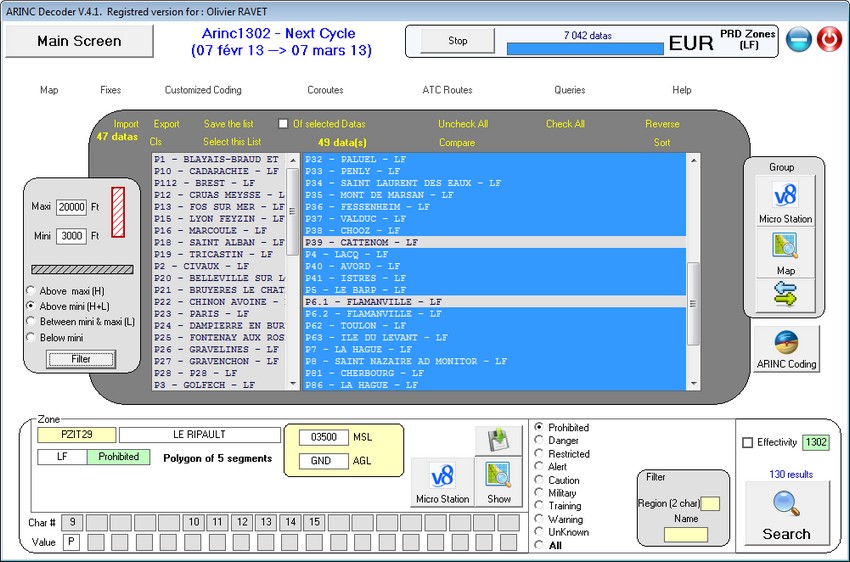
For areas "PRD" (Prohibited / Restricted
/ Danger) but also the Alerts, Caution, Military, Training, Warning and others.
You can filter by geographic area and / or by the name of the zone. During the
first search (fastest) you can enter one (or more) first (s) letter (s) of the
region, then this will accelerate the processing.
(Example, France PRDs area only, put ...
Then click the button ![]()
For just areas "Prohibited" you can "refine" the search in the box below.
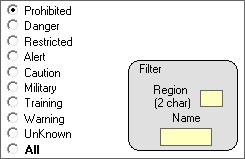 (It is not necessary to type again the code of the region)
and press on the button
What makes this case in 49 areas and 130 lines.
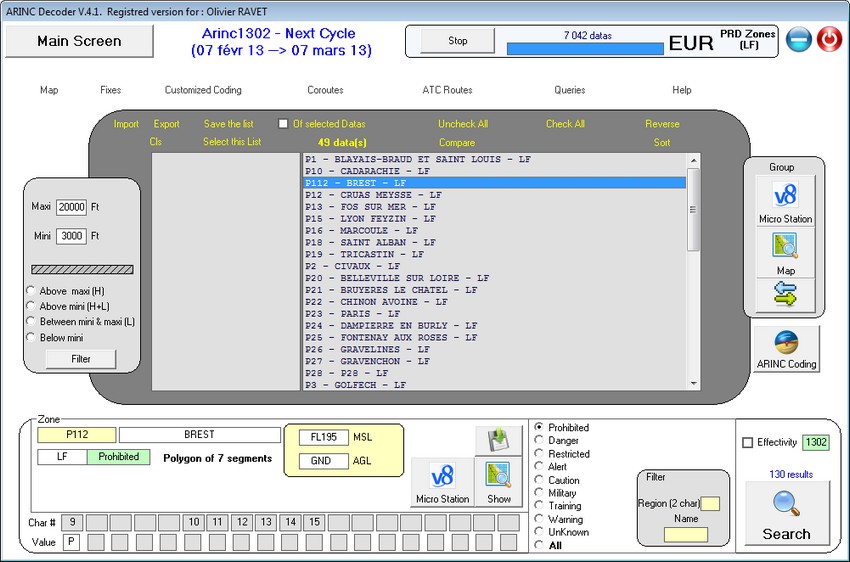
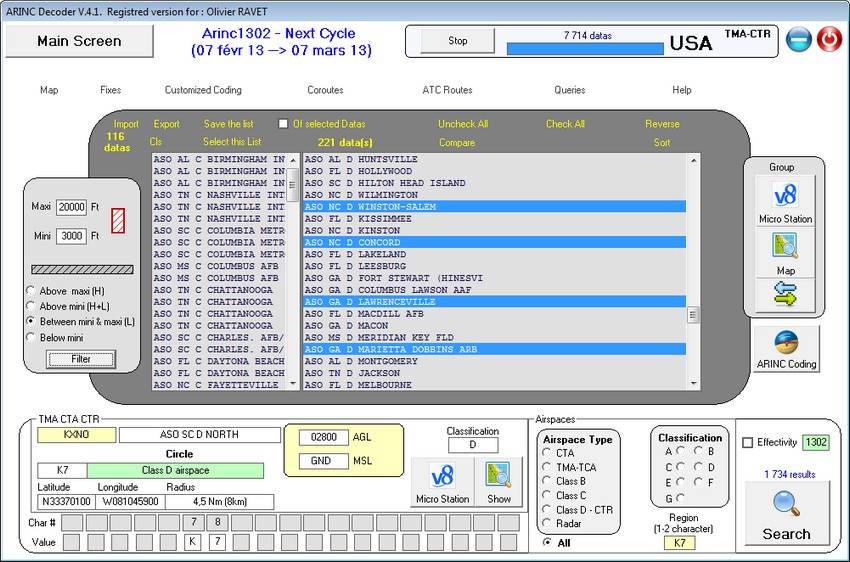
For Zodans, FIRs and controlled spaces you can filter the output.
On the left, two areas to inform, in feet, the maximum altitude and minimum altitude.
Make the choice, for example areas which are very likely to interest enroute activities, above 3000 '...
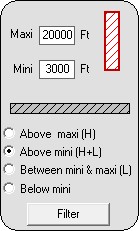 Press the button "Filter"
There are 47 areas that does not match the criteria and are deselected.
The three buttons on the right

 or
or 
Appear in the viewer or all selected areas will create a file compatible with your mapping software (Microstation V8 here)
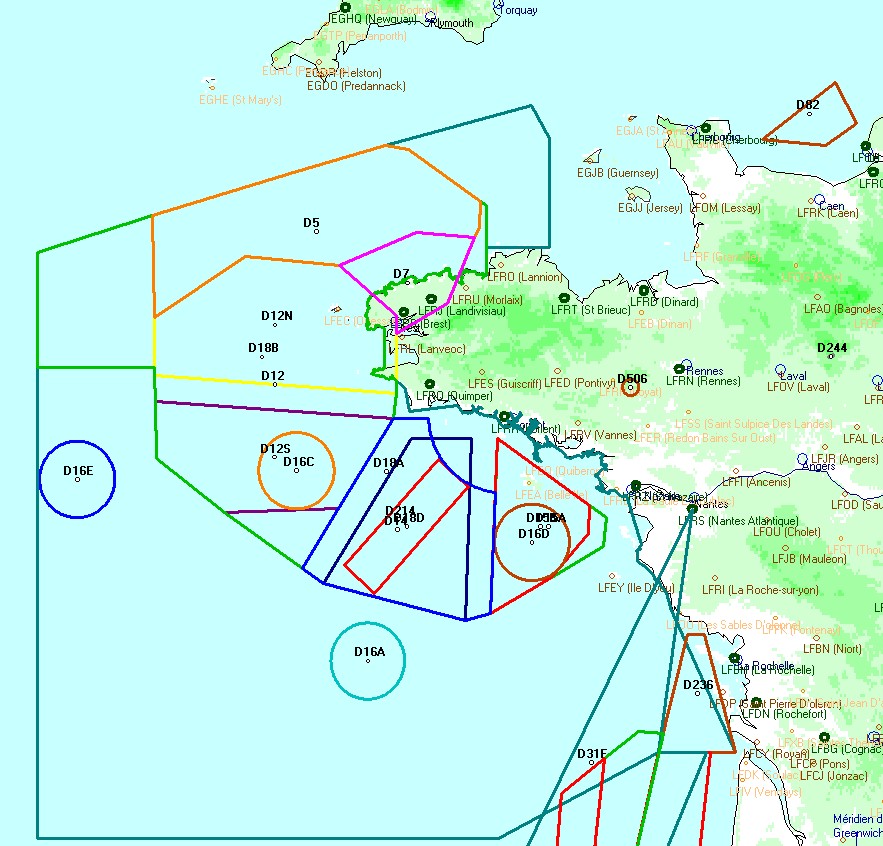
Examples:
All dangerous areas of Britain:
On Google Earth,
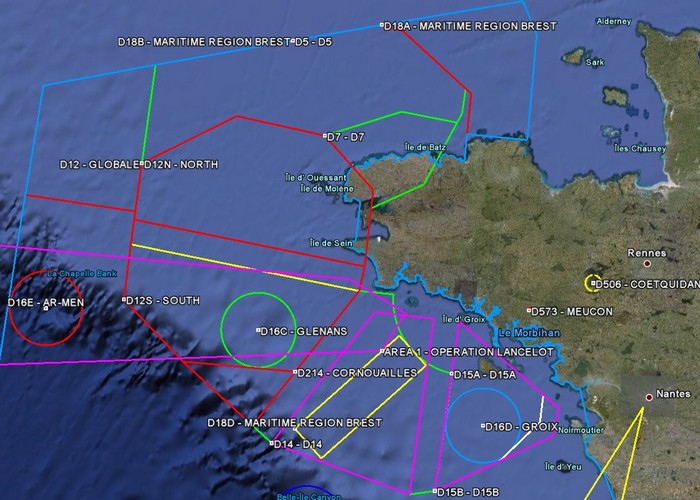
Or the internal viewer:
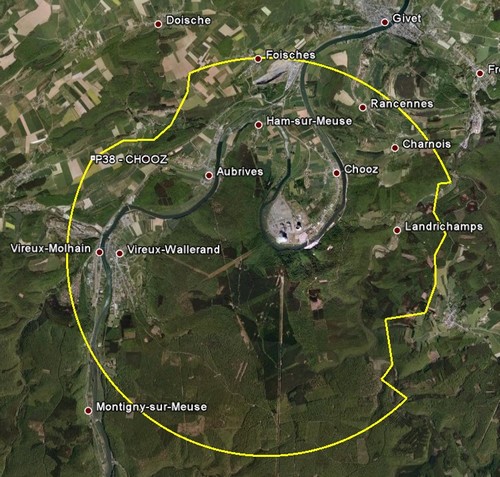
the P38: CHOOZ nuclear power plant, wedged between two borders of Belgium, give this file (in export MS)
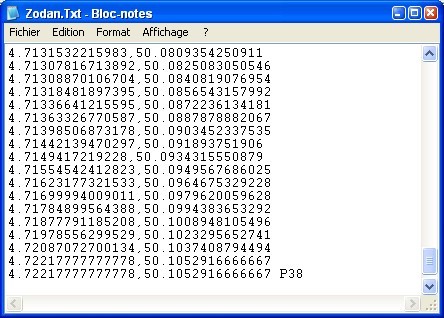
and displays this on google earth:
 or
or 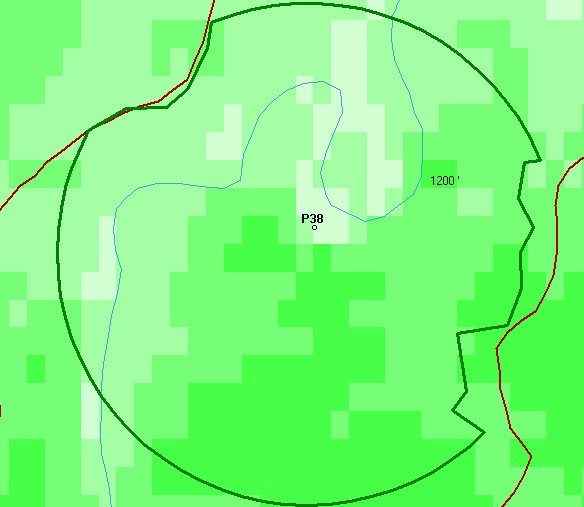
buttons and
or the area below will
display or will file for the selected area.
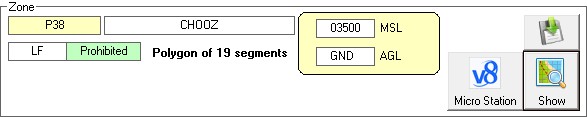
By displaying the characteristics
of the area in question ...
Button ![]() allows you to save this area, in order to edit it as you wish in the module
"Custom"
allows you to save this area, in order to edit it as you wish in the module
"Custom"
Exactly the same principle as for Zodans.
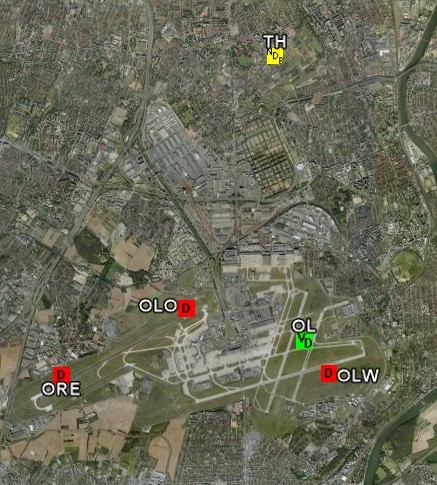
For these two FIRs must be the query in the Beirut area "OL" and then again in the region of Tel Aviv "LL", this in the "MES".
Or, without ICAO code information
in the MES area, you can select from the list of FIRs: (Here sorted by the button
![]() )
)
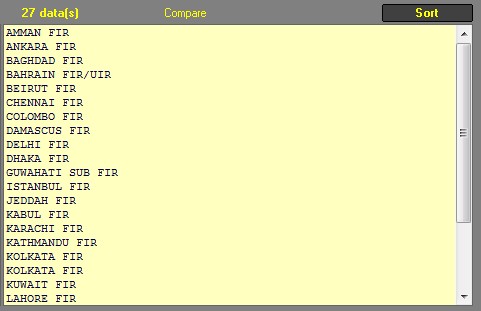
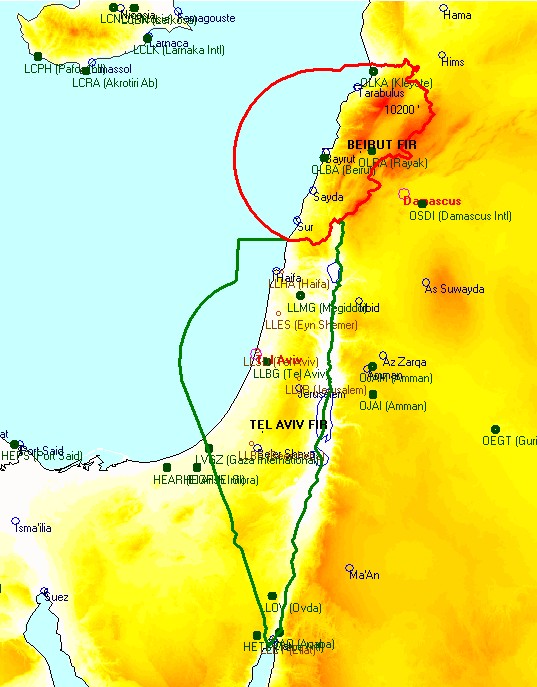
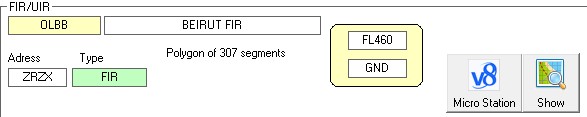
Basic information is below:
Basic Selection: Controlled Areas (Airspaces):
The principle is the same and to view or export the TMA, CTA, CTR, etc..
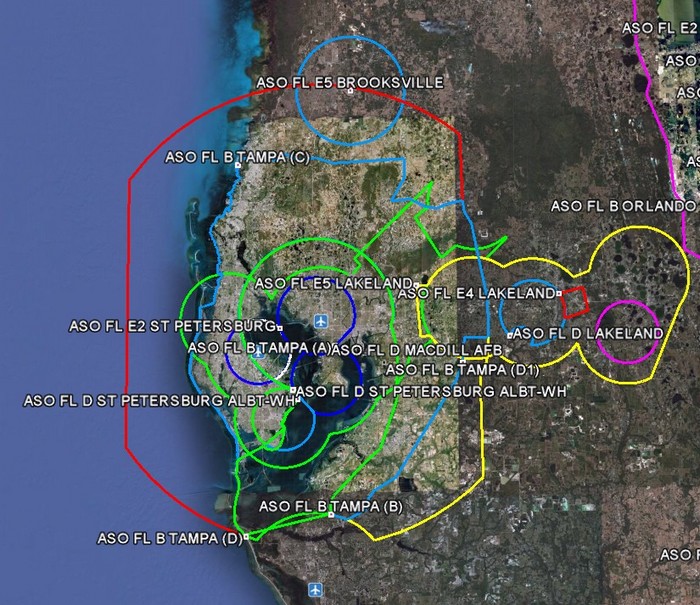
Make basic selection as usual, here in Russia and Asia, all the airways beginning by "B":
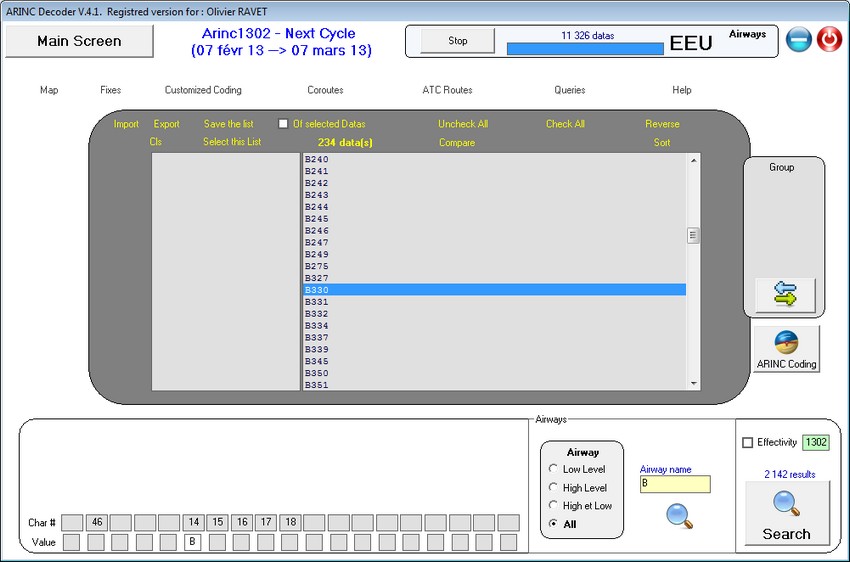
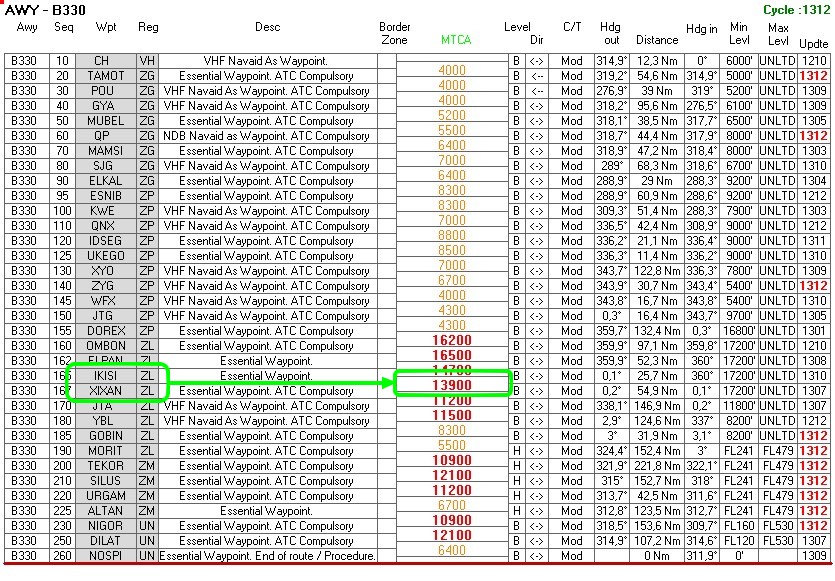
Select the airway of interest, this opens the window giving complete information of the airway and its fixes in the selected geographical area.
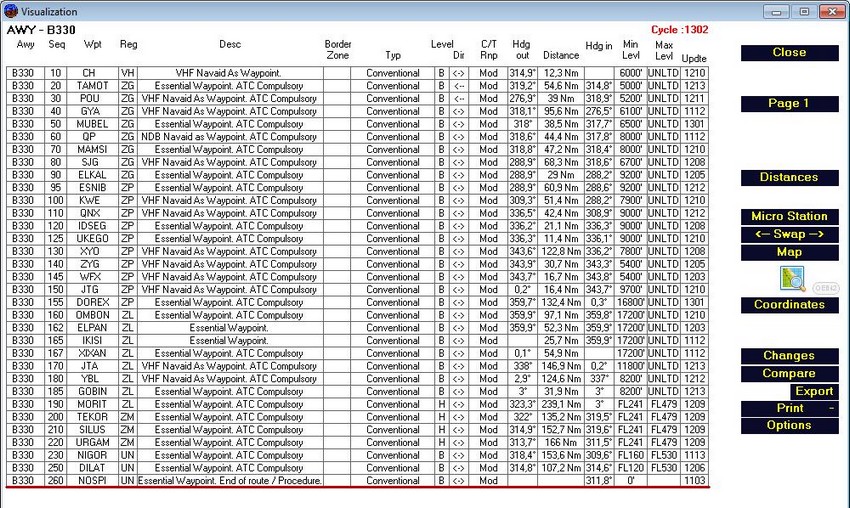
Before you push on any button this gives you datas coded in the database.
- Level "B" for all, "H" and Top
"L" for low levels
- Border area, indicates that the Airway continues in this area.
- Direction: <-> for bi-directional, Backward or Forward, or else.
- The two headings for inbound and outbound points, distance and levels. When
several airways use the same name are separated by a red line, you can deselect
those that you do not want to see by clicking on its name to the left.
- In RNP column, value is written when it is known and different than 10 Nm.
You'll have here the complete description of the controls of this module.
in internal viewer:
If you only want to view the part of this airway in the FIR ZP (KUNMING) you just have to type "ZP" in the region textbox.
Module Vizualisation... Description:
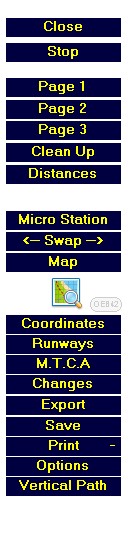 |
Close: Will close this window. Page 1 / 2 / 3: When an Airway or a procedure
has too many lines. You can see pages with those buttons. MicroStation: Export for a software all
the parameters of the procedure or Airway. Coordinates: Make the calculations without
exporting on the map. The Mapt coordinates are yellow to see it with
no doubt. Changes: clicking here will compare this
screen with the same of last cycle, in yellow boxes the changes. The
old value will be in tooltiptext. |
 |
Vertival Path: Same action than the button in the
previous menu. |
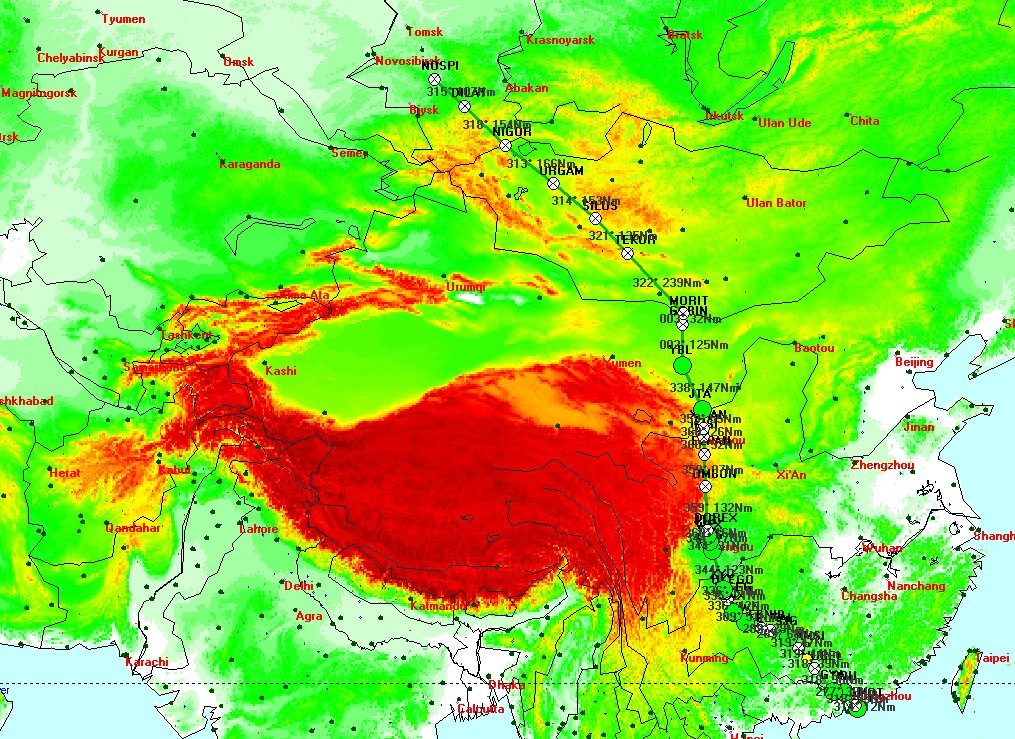
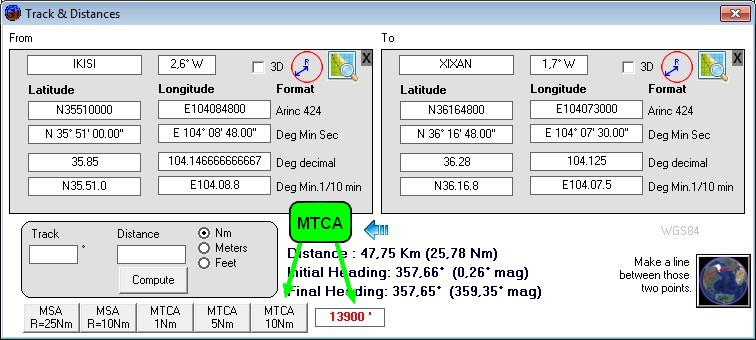
MTCAs Minimum Terrain Clearance Altitude:
This software can compute the MTCA of any segment of route, with the SRTM datas for terrain.
If the MTCA is for an airway, the buffer will be 10Nm each side of the centerline, radius of the 2 semicircles = 10Nm
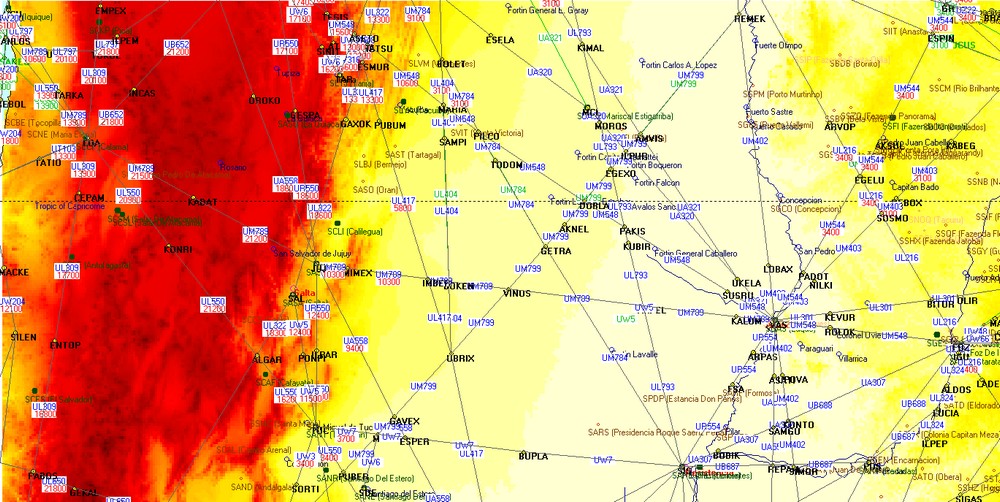
In the Airway module, for any airway, just press the button M.T.C.A
Here for example between IKISI and
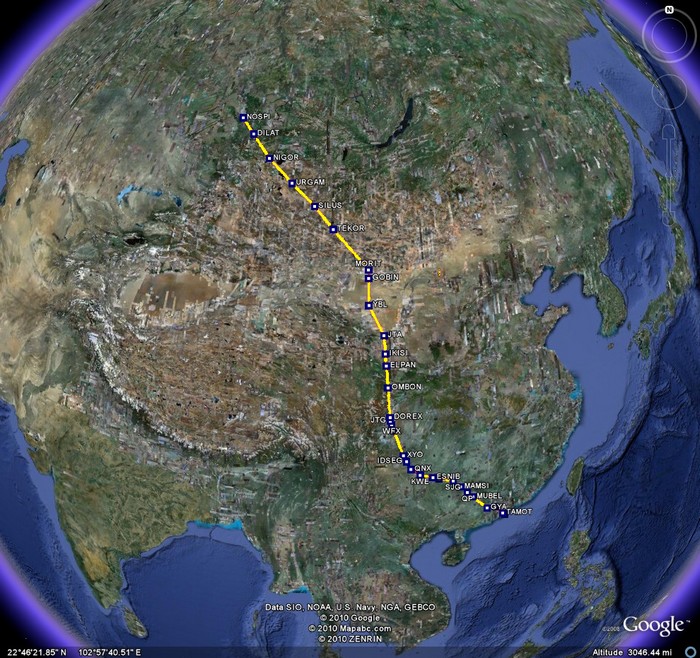
XIXAN on the B330 airway. Not so far from Lanzhou
With a buffer of 10Nm the max altitude
is at a mountain near JinLongMiao (I don't know exactly, sorry) it's culmination
is at 3610m
That's 11845 feet rounded at 11900 feet.
because we are above 6000' we take a margin of 2000' (1000' if below 6000')
And the MTCA is 13900'
If the MTCA is for a STAR or a SID, the buffer will be 5Nm each side of the centerline, radius of the 2 semicircles = 5Nm
If the MTCA is for an approache, the buffer will be 1Nm each side of the centerline, radius of the 2 semicircles = 1Nm
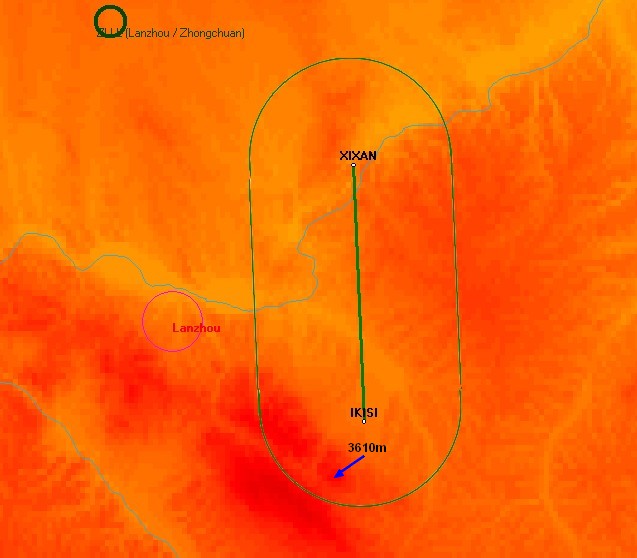
You can make this calculation from
any leg in the module "Track & Distance":
MSA, Minimum Safe Altitude, allows
you to make this same computation from the center of a circle, 25Nm or 10Nm
radius.
Color is the same than in Airway
or MTCA module:
Cyan : you are above sea or ocean
Grey: MTCA is below 3000'
Amber: MTCA is below 10000'
Red: MTCA is above 10000'
MTCA Module:
When you click on this button: ![]()
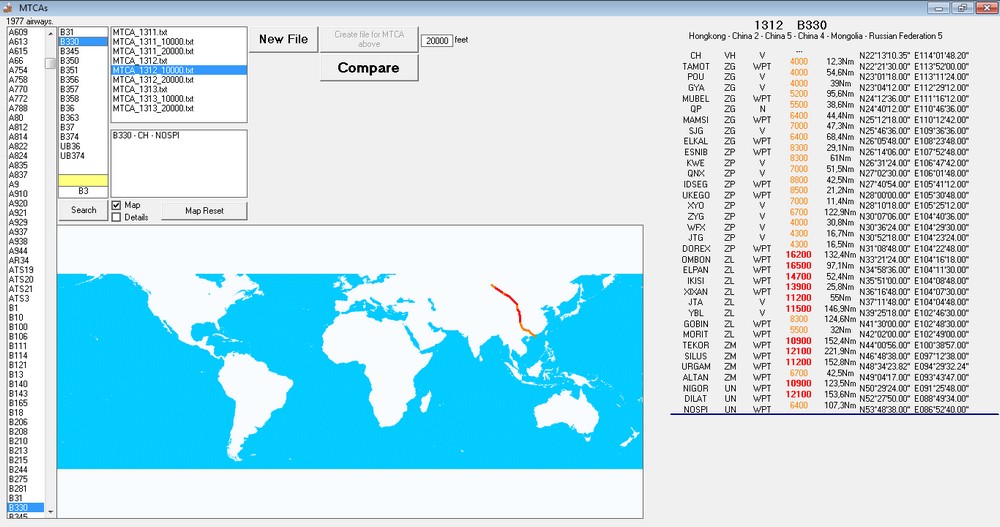
Button "New
File" will create a file from your selected Arinc file. The process takes
approximatly 12 hours:
- Extracting all airways and fixes
- Matching datas of coordinates for all legs
- Calculating for each leg the MTCA as per the method describe above.
- Storing this data for each cycle.
- This file will after enable the "Airway" selection in the map menu. (Very useful for quick plotting, all details are fully explained HERE)
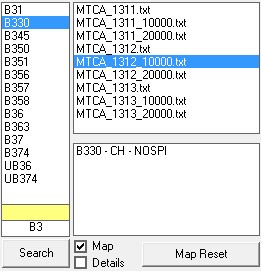
Above the "search" button, in the white zone you can type a part of
a name of an airway.
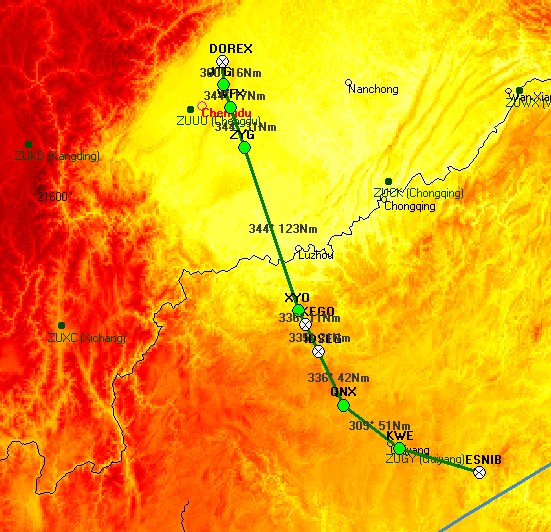
Here "B3" give the list where we can find the B330. Clicking on it will show all details of this airway, and will draw it on the map.
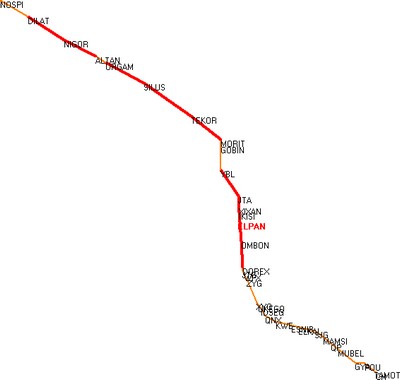
Clicking in details will plot the
fixes of this airway and join them with lines of the color of the MTCA:
You can also search by any fix in the airways, typing in the yellow boxe
After it's easy for anyone to extract only datas that is interesting for him... With the button "Create File For MTCA above..."
Grid Moras. This is the only selection that does not require geographic area, a map showing the "Minimum Of Route Altitude" is displayed giving the MGA of each square degree:
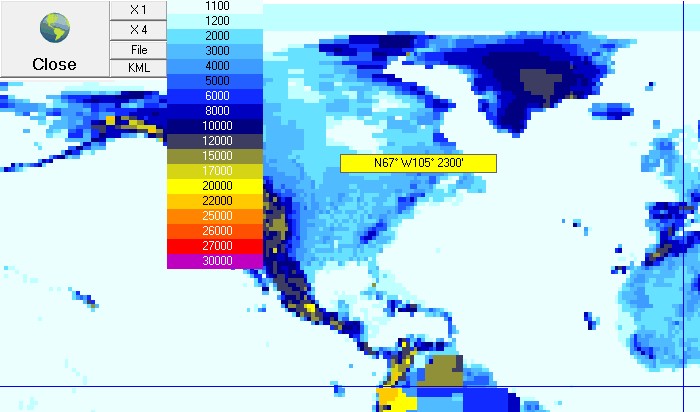
Flying over the mouse of each point gives the coordinates and MGA
For more visibility map can be zoomed
into four parts by pressing the button "X4"
. 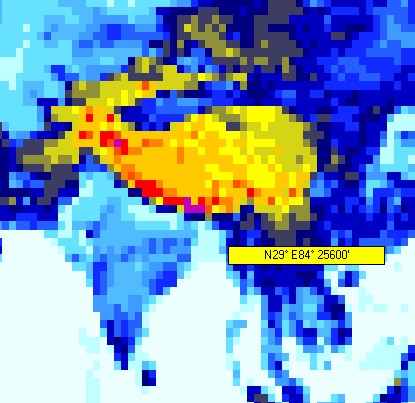
You can create a file (Button "File") Which will replace the one in the map viewer, to update the grid Mora of this one. You can also create a file for an external application.
The button "KML" will use the first created file by the "File" button + "Yes" and the will create two files for Google Earth (or MapsWithMe) to display anywhere the Mora (over 10000')
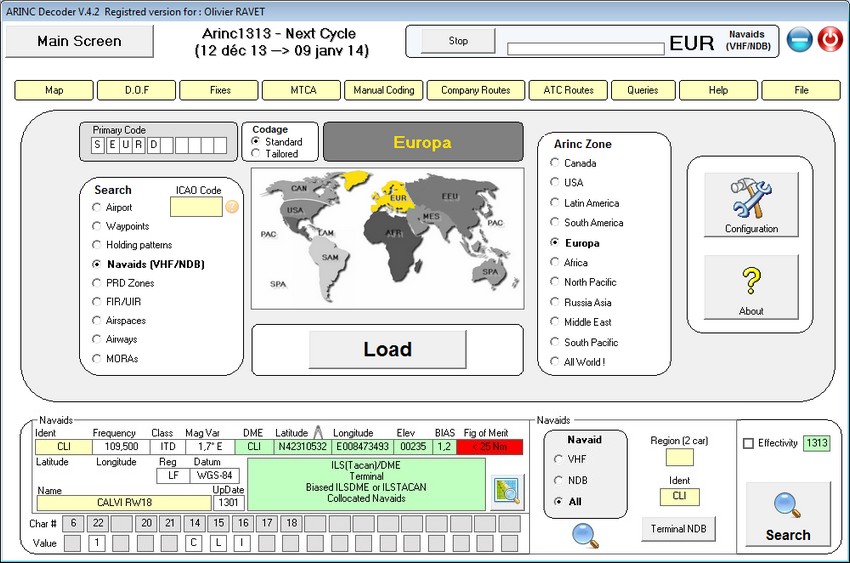
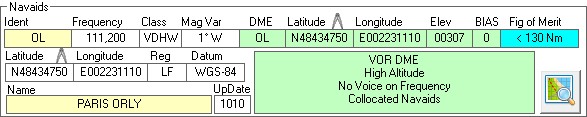
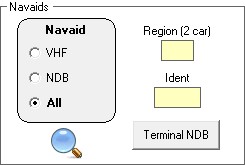
Display the NDB and VOR enroute. (The ILS, Glides, localizers, Locators, Markers and terminal NDBs) are visible in the selection of airports.)
The icons are different in the case of an NDB, VOR, DME, VOR / DME. (The color is different in the internal viewer) Selection in the list gives all information:
If the position of the DME antenna is different than the VOR antenna the coordinates will be red.
The terminals NDBs are hidden in the file, to see them you must press the button "Terminal NDB" in the selection window:
You can optionally include the region (2 characters), or identifier, the list will be shorter ... (They are not that so many, and they are increasingly dismantled ... a waypoint consumes less, rarely falls down and requires less maintenance ....)Click in the box "Update"
Press 
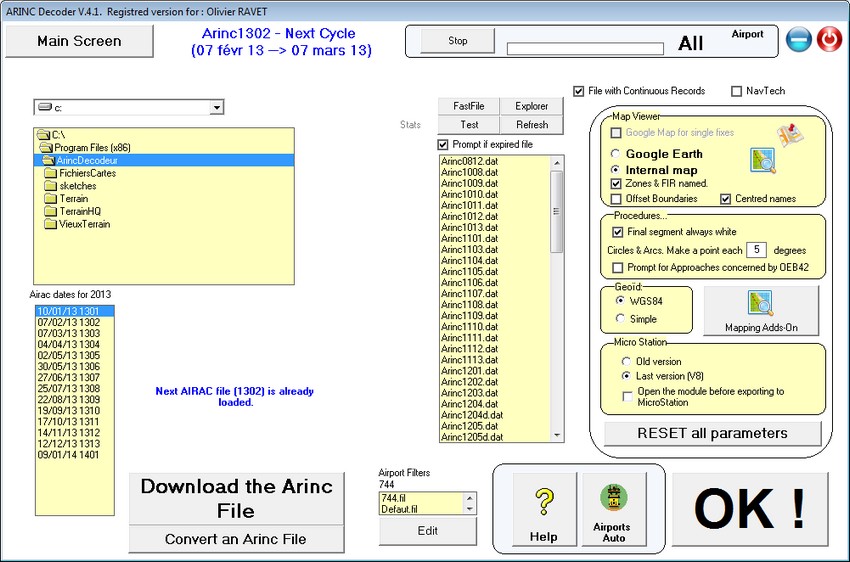
Here you select your ARINC file (Arinc
424 dataset)
The list at the lower left gives for the current year dates and availability
Airacs file (about 16 days before).
At the top of the program you'll see the limit dates of this cycle.
The indication is red if the file is outdated, Green if it is correct and Blue
if the file is for next cycle.
You can choose to view between google
earth and the internal viewer.
Google Earth requires an active internet access and is not free for companies..
In the latter case, there is a way
where the point is unique (a waypoint, airport, navaid, etc..)
To display on this Google map (in a web browser) by checking the box .... .![]()
The icon buttons becomes ![]()
In the main menus, buttons ![]() can
switch between one and the other viewer. (The function to view in google map
is automatically disabled when the internal viewer is selected.)
can
switch between one and the other viewer. (The function to view in google map
is automatically disabled when the internal viewer is selected.)
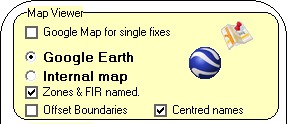
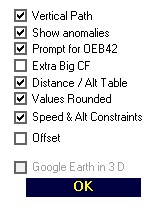
Zones and FIR named , the display area for each zone name at its center. (if
checked).
Offset Boundaries. Firs have all same boundaries, with this checkbox you can
see them, thanks to a small offset.
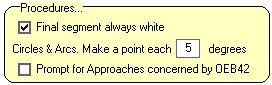
The circles and arcs (in FIRs and ZODANs, DME arcs or RF legs in the procedures)
are drawn point by point ... Here you can determine the precision (for a circle,
if a point is created every degree it will take 360 points).
36 points will be necessary for a
circle and a point every 10 degrees ...
Depending on your level display, select what is less greedy ...
Prompt for OEB42. Just for those who use Airbus with FMS Thales less than release S7...
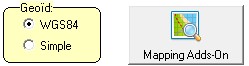
Geoid: In the drawing arcs and circles, it will change very little from
state to state but the points can be calculated using these two methods. Changes
are made to feel more if you use the module "Center RF leg".
The button
 to download
high-resolution maps and terrain datas for the internal display. An Internet
connection is required, after a few moments a window will open to install these
maps on your hard drive.
to download
high-resolution maps and terrain datas for the internal display. An Internet
connection is required, after a few moments a window will open to install these
maps on your hard drive.
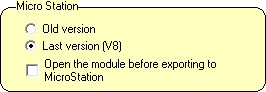
To create files directly exportable in microstation, format .Nav (old version)
or .txt for the new version of MicroStation (V8)
The icon buttons will be that the version of MicroStation: ![]() for the old version and
for the old version and ![]() for the last.
for the last.
The module that you are proposing to open before export (when open zone or FIR by the bottom button) lets you view each construction point before, and see these points one by one. (more about this module)
![]()
Button "Reset All Settings" ... in case of malfunction... (Sometime a windows
goes out of view, this button will be the solution exept if.... it's this window
wich disapear... and the only solution is to open the registry and to kill the
key "ArincDecoder" !)
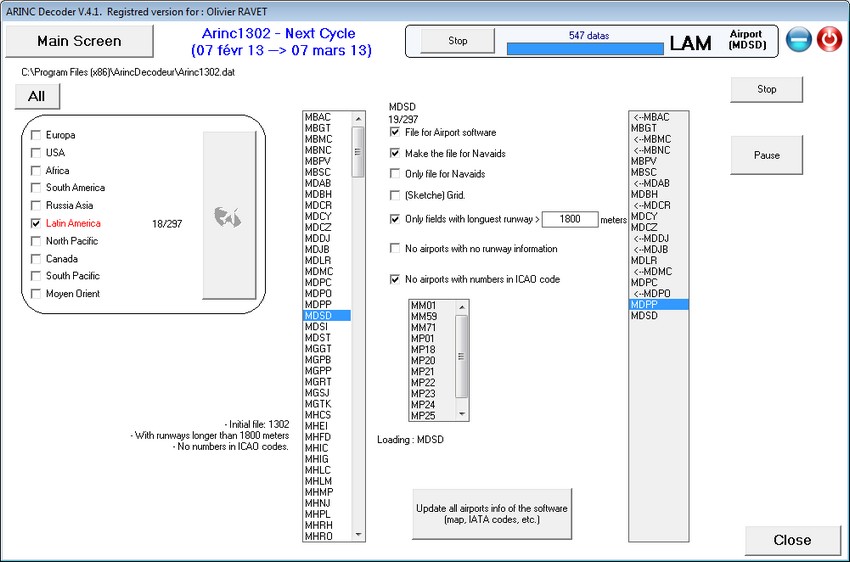
Sketches Auto:
will display a module to get all the syntheses of all the fields of the database ...
Runways, Navaids, MSA, coasts, com frequencies and characteristics of ILS will be displayed on a view that can be called using the program "Summary" or "Airports".
There are ways to limit the number of field by eliminating airports where the runways are too short.
If they have not been created, a
label will prompt you to create files for zones. For faster
processing.
The solution is to switch off the program and restart it when the pop up window
has gone.
The 13,500 airports are treated in one night, approximately.
The check box "Create a file to the Airport software" will generate a file for the Software "Airports":
(Example for the field in Boston :)
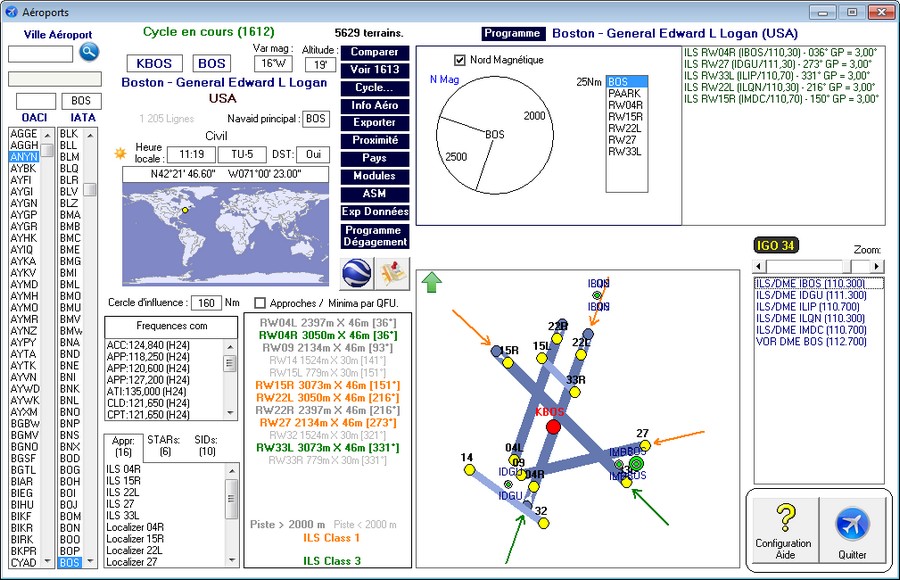
Button 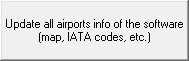 used to redefine the fields to display on the map of the integrated display.
And the display is always updated!
used to redefine the fields to display on the map of the integrated display.
And the display is always updated!
Specific Search:
Looking for a special information ...
Example, you want in the United
States a runway between 16,000 'and 17,000' in length. Pressing the button  The Arinc lines are shown. So we see that the runway length is written in characters
23 to 27:
The Arinc lines are shown. So we see that the runway length is written in characters
23 to 27:
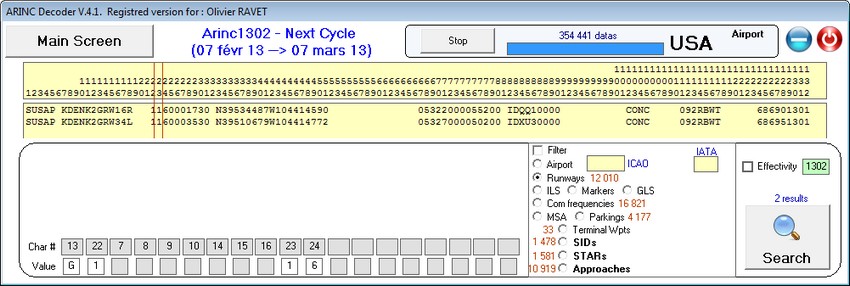
We inform 23 and 24 and below 1 and 6
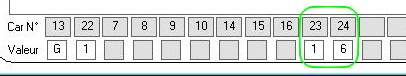
And the "Search" button will bring up the runways of Denver ... the longest in the United States.
- Another example is the highest airport in the world ...
Open any airport and displaying the line Arinc, we see that the altitude is referred to from characters 57 to 61 :
do a search "All areas" of airports then.
putting "57" then "1" we get all
the land where the altitude is above 10,000 '(28 cycle 1109)
It is then easy to browse these high
places ...
Exportation in excel mode and in your sreadsheet application you'll be able
to sort them by altitude, with the only datas you need.
You can download the explanatory code arinc 424-18 to juggle this function for each record and understand the positions of the data.
Saved Query:
The button ![]() allows those who use research specific to recall just to save having to always
enter the criteria in the ARINC line.
allows those who use research specific to recall just to save having to always
enter the criteria in the ARINC line.
You can store 4 queries, and call them whenever you want.
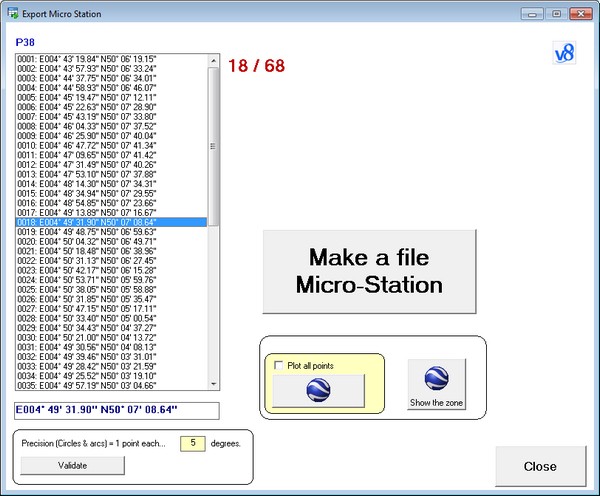
Here you have the opportunity (as in the module configuration) to change the plotting accuracy for arcs and circles. Then press "change" to redo the list.
You can display the points, and watch them.
1 point for every 10 degrees.
1 point every 30 °: lighter but less accurate (to avoid, so)
The large button makes the file compatible (depending on your version of MicroStation).
passage through this module is not
necessarily useful, may be masked, since the module "Configuration"
Each Arinc file contains only valid
information corresponding to the cycle ...
Here's how to know what changes occurred in a database, from one cycle to another.
This will not give you informations on deleted informations, but added or modified.
A concrete example ... You want to
know, in Sweden, the updates of PRD zones for this cycle ...
Easy ... all the same but click here: 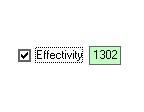
In the ICAO code in the upper left already enter ES (for Sweden)
 and optionally
Three areas have been updated (or are new).
The problem is that the display now shows us that the points changed, those who have not changed are not displayed, then you must feint ...
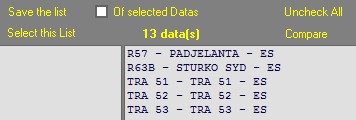
Click on "Save the list"
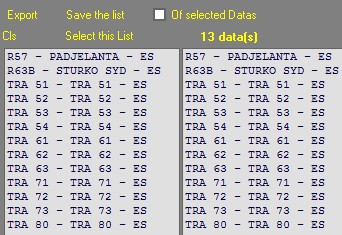
(Areas of interest are stored in the left list.)
Now uncheck the box "Effectivité"
![]() and launch
a new complete search ()
and launch
a new complete search ()
142 in our area, our 13 areas are left buried, but clicking on "Select list"
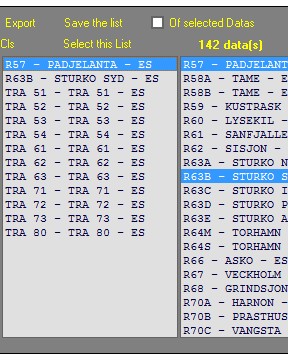
The 13 areas (with all the points)
are ready to be exported, viewed, or displayed ...
You can also click in the left list, areas are displayed individually.
This manipulation (by passing the list on the left) is not mandatory if you
search for updates elements having only one line (Navaids, waypoints, holding
patterns, ect.)
Another example ... The modified Navaids cycle 1011 ...
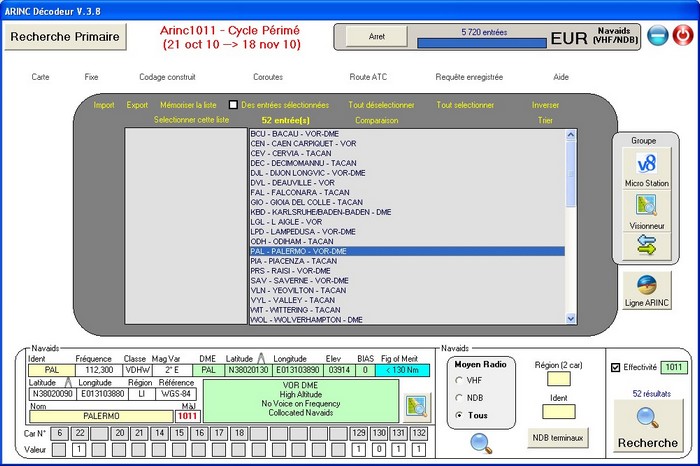
By pressing
you will have them all (new and modified):
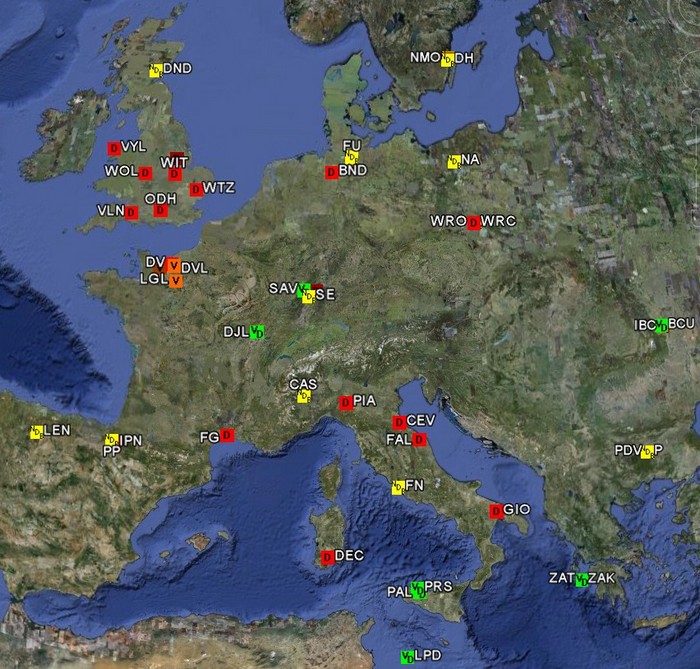
The overview of coordinates (where they are and whatever they are) shows the different formats that you can copy + paste:
example: 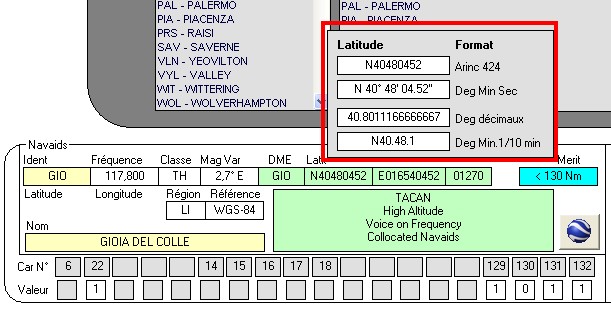
But ! (ouch ouch ouch!) This method does not obviously show items that have been deleted!
Thanks to God, the program will allow you to see that if you have saved the previous cycle.
Press the button ![]() then select the cycle you want to compare in the right list:
then select the cycle you want to compare in the right list: 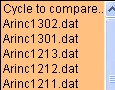
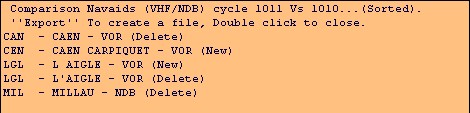
The two cycles are analyzed (during this time we do not touch anything unless you want to leave, with the "Off") then you will ...
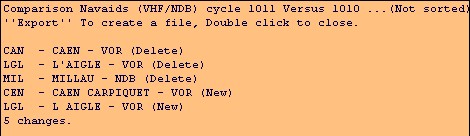
It will be seen for example here that LGL is not exactly new, it is modified (the apostrophe in its name) but it's a deleted info and an info added.
Pressing the button ![]() objects will be displayed as well,
objects will be displayed as well,
On the one hand the new, the other all deleted. (If you made a comparison with the base of the previous cycle, the info will be displayed in rows by clicking "New" but not in the deleted because it is not there anymore ...)
This function is operative for all lists, even the "saved queries".
As I said previously, the file contains only current data, the changes are not
visible. However you can, when a field "UpDate" is present, (example: ![]() )
Click in to see what has changed ...
)
Click in to see what has changed ...
The airport of Essaouira, Morocco has been changed to 1112 cycle ...
After querying the database prior to the last update (so it must be installed!) You will display that will flash like this:
Settings changed since the last cycle are obvious ... (Here, length of the longest runway, Magnetic Declination, Transition altitude, position of the reference point.)
If the information does not exist in the previous cycle, the alert message, same if you do not have the correct file.
If no change is visible that is because
the change of a parameter is not displayed, pressing the button ![]() the flashing and the two lines will be displayed. The experts will love this...
the flashing and the two lines will be displayed. The experts will love this...
![]()
This feature is not available for Zodans, FIR, controlled spaces or airways, because there are more than one line per Arinc information.
� �+
�+  +
+![]()
This module will open:
�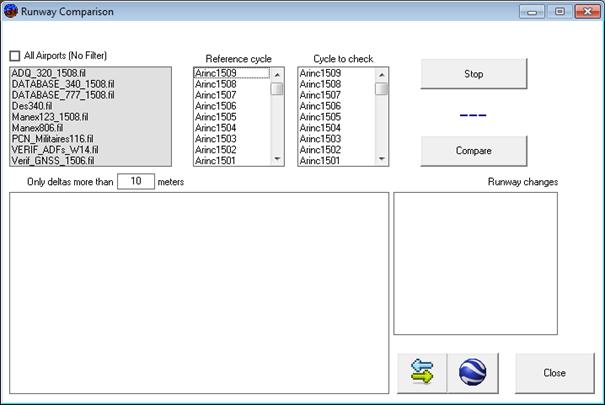
Select a filter or select "no filter" option to scan all your file. Select a reference file then a file to check
Push on �![]() �
�
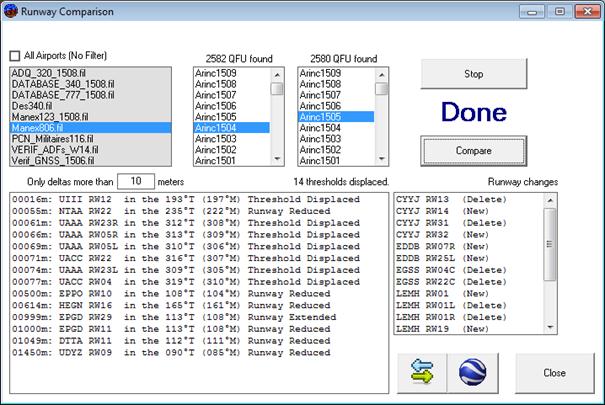
On the left,
Each line explain if the threshold moved in the runway axis (so runway is reduced
or extended), if not the threshold is simply displaced.
Buttons ![]() ��will plot the threshold selected for the 2 cycles :
��will plot the threshold selected for the 2 cycles :
Example:
![]()
Where we see that � displaced � is for the re alignment to geodesic system WGS 84 :
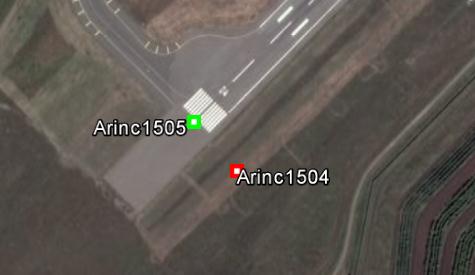
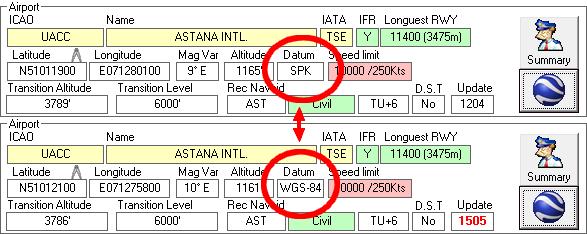
The line....
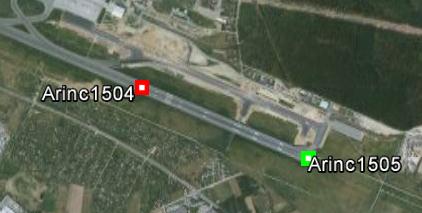
![]()
Is for a displaced threshold due to a work in progress
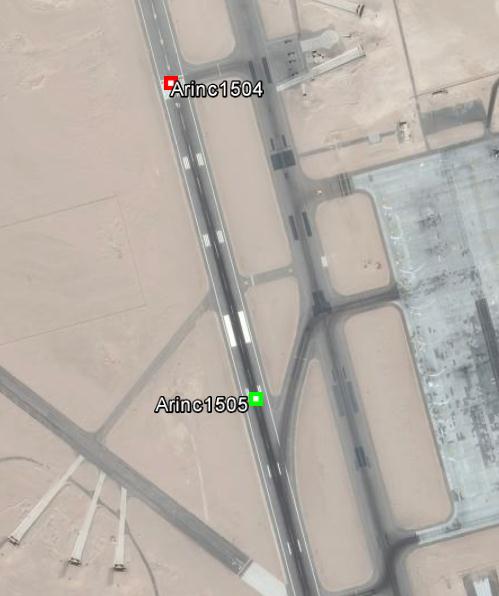
- The ligne�
![]()
Is a re opening of a reduced runway.
If you see this...
![]()
�And your runway is extended and it is obviously a work in progress you'll have to advise the crews that in case of landing, and until the EGPWS terrain database (TDB) is not up to date, they will encounter the Alarm "Too Low Terrain !!!"
In the meantime, the RAAS at take off will alert � On Taxiway � then � Approaching Runway � then � On Runway �
Automatic verification procedures.
We can let the software work only for us to check the final segments of approaches:
- Call a list of approaches to test ... example here in Africa:
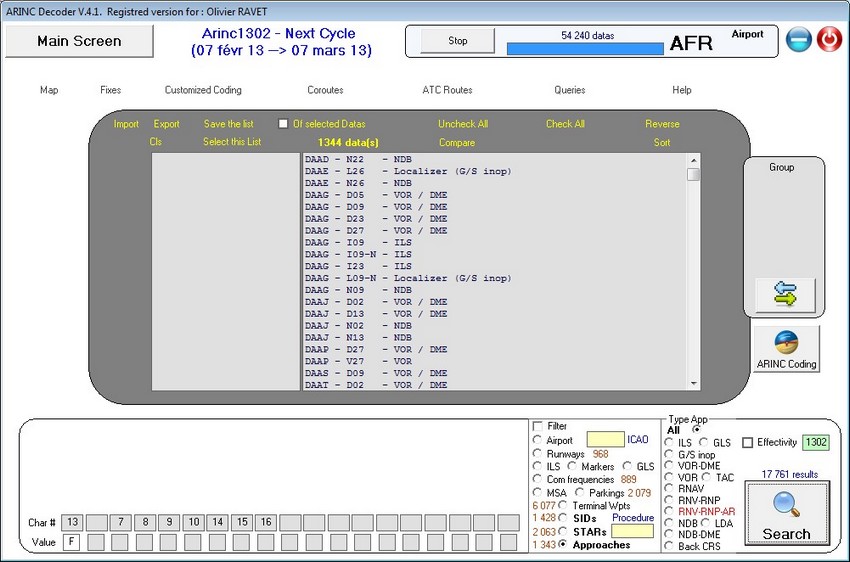
- Press ![]()
and a new button will appear: 
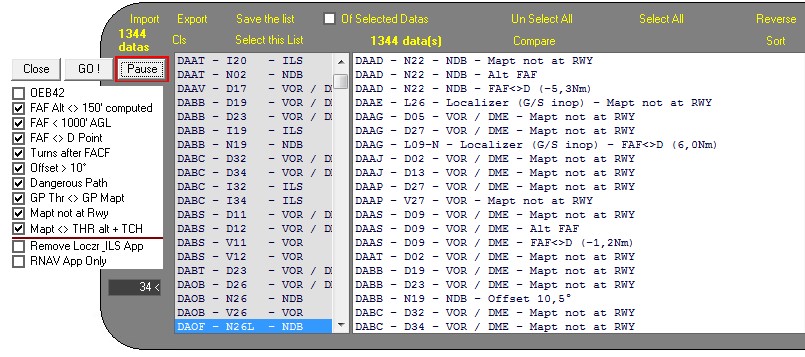
By clicking this you will be added
to the display:
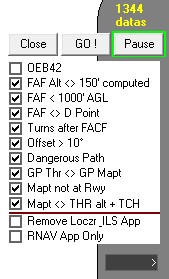
Depending on the boxes ticked that you have left, after pressing "GO!" Approaches
with the cares of the query will be added in the list:
Button ![]() will make you a file directly from this list.
will make you a file directly from this list.
Explanation of defects tested:
OEB 42: For Thales FMS monted on Airbus Aircrafts. This to show NPAs impacted by this bug.
FAF alt <> 150 'Alt calculated: The altitude at the FAF should be coded according to a constant path to the Mapt (coded according to plan). If we find more than 150 'apart the approach will be in the list.
FAF < 1000' AGL: If FAF is below 1000' height. (You'll have to be stabilized before the FAF)
FAF < > D Point: The Descent point is not coincident with the FAF.
Turns after FACF: Means that it's not a strait line from IF to Mapt... the approaches with curves after the FAF are subject to special permits for the aircraft and crew.
Offset > 10 degrees : if the axis of the last segment is not in the line of the runway, crew should be aware of before planning to land there !
Dangerous Path: If the angle is less than 2.5° or more than 3.5°
GP THR< > GP MAPT: If the MAPT is not at the runway threshold, the descent should not be "broken" to complete the approach, otherwise it could be destabilized. if there is more than 0.3 degrees apart, the approach is added to the list.
Mapt not at Runway: This cause some troubles for Honeywell FMS on Airbus and the altitude of the Mapt as to be check with the minima (not to risk to be after the Mapt in descent to the minima)
Alt Mapt <> Threshold Alti + Tch: Altitude at the last point of descent. Normally you can meet a few feet of error ... but not too much, otherwise there is an error. The TCH (Threshold crossing height) is declared officially by states, it is the altitude in feet crossing the threshold of runway on landing, usually 50 feet.
Remove Localizer App: Approaches "Glide slope inop" steal differently (never managed) and are often recopies ILS approaches. The vertical path with no value may not be interresting to watch here.
RNAV App only: if you want to check only RNP APCH.
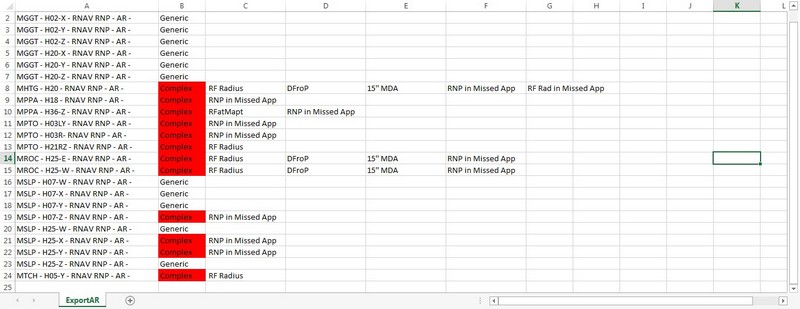
RNP AR selection and checking.
This soft can automaticaly filter the RNP-AR (autorization required) procedure depending of their complexity. The procedure can be categorized in 2 lists. Generic or Complex.
If a procedure has one of the following:
it will be considered has complex and will have to follow specials additionals tests before been flying. (if not it's still "Generic")
When all the procedures are listed as above, just use "RNP AR" check box and "Details" to show the list:
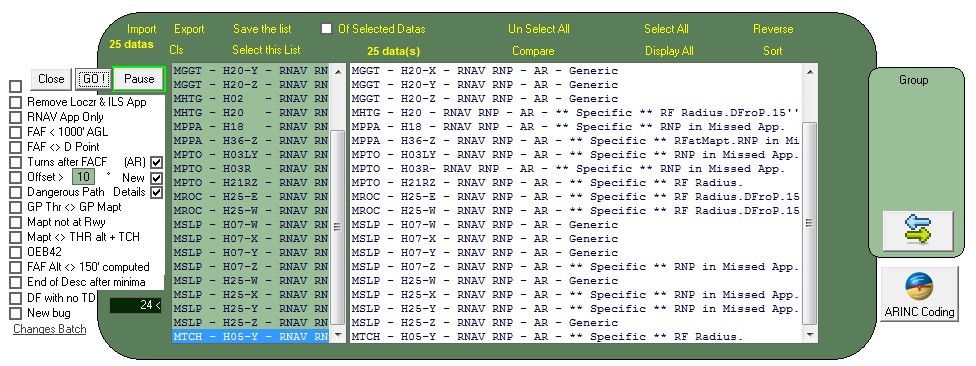
You can then export to see this in an excel sheet...
RNP (AR) operation. Mask Angle for RAIM outage prediction.
For a designated airport, the terrain need to set your prediction tool to a certain angle over the horizon. Generaly 5° is enough but in montanous areas we have to set an higher value.
On the airport selection press on the button "Mask Angle"
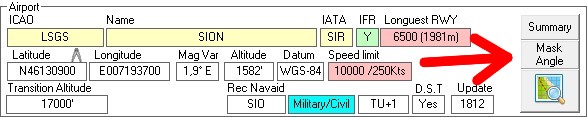
This will create a google earth file that shows a 100Nm radius circus arround the airport:
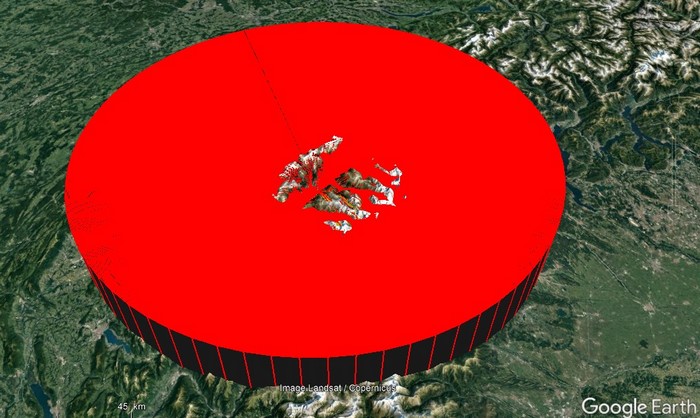
and this new module:
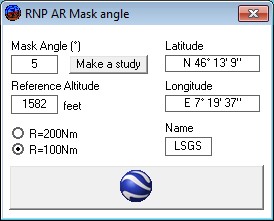
If necessary the radius can be set to 200Nm if the terrain is high and far from the airport.
The "Make a study" button will help you create files arround the angle entered, and to determine when all terrain is overlap.
9 files +/- 2 ° between the entered value:
Where we see (when you select / deselect each file one by one) here that the limit is for LSGS (Sion) at 18°
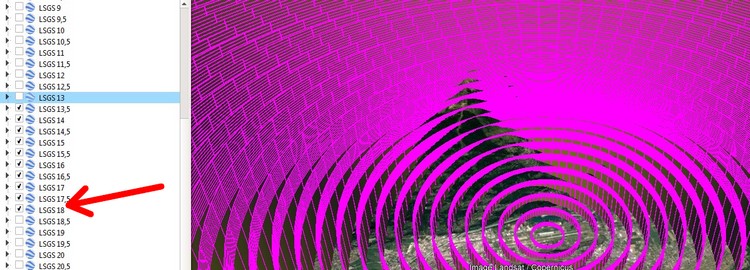
(All the circles are above the terrain)
See the Tutorial, for this function.
SID STAR optimization:
For enroute alternate airports you can keep the SIDs going only in one direction and excluding the SIDs of the opposite direction.
Same for the STARs, you can keep only the STARs going to an airport from one direction, excluding the others. This to optimize the size of the aircraft nav database.
First, you create a filter of the
airports you want to optimize.
EDDL
EDDF
LIRF
LIMC
LFMN
LFKB
You select it.
Script & Batches + SID/STAR RCF.
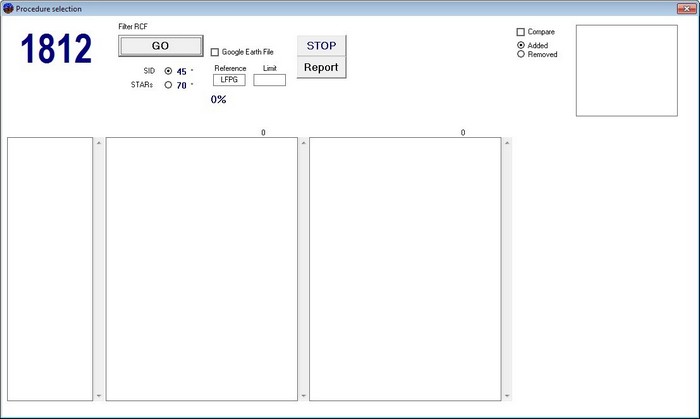
Indicate the reference of your flights, (Flights going to and from for the procedures) here = LFPG.
If you insert an OACI code in limit, the calculation will be done only for this airport. (and not for the fields of the filter)
Indicate the angle of precision for each type of procedures (45° mean that you will keep only the SIDs that are inside this limits)
Clic GO and...
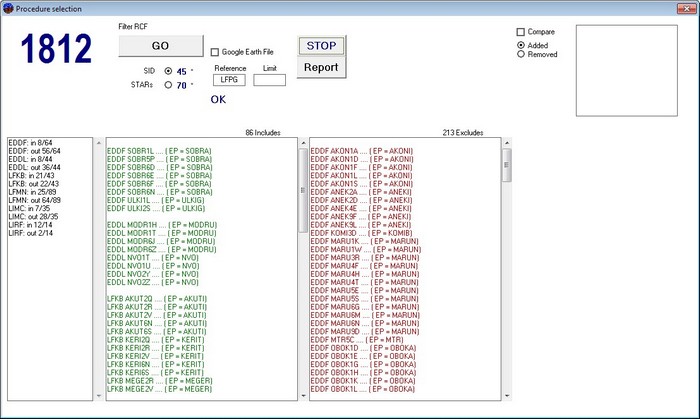
Left green selectable list are all
the procedures you can ask to keep in your FMS, they are SIDs "looking"
in direction of the reference airport (in the limits of the angle you put)
Right red list is those SIDs you can ask to remove from your FMS, because you
certainly will never need them for your operations...
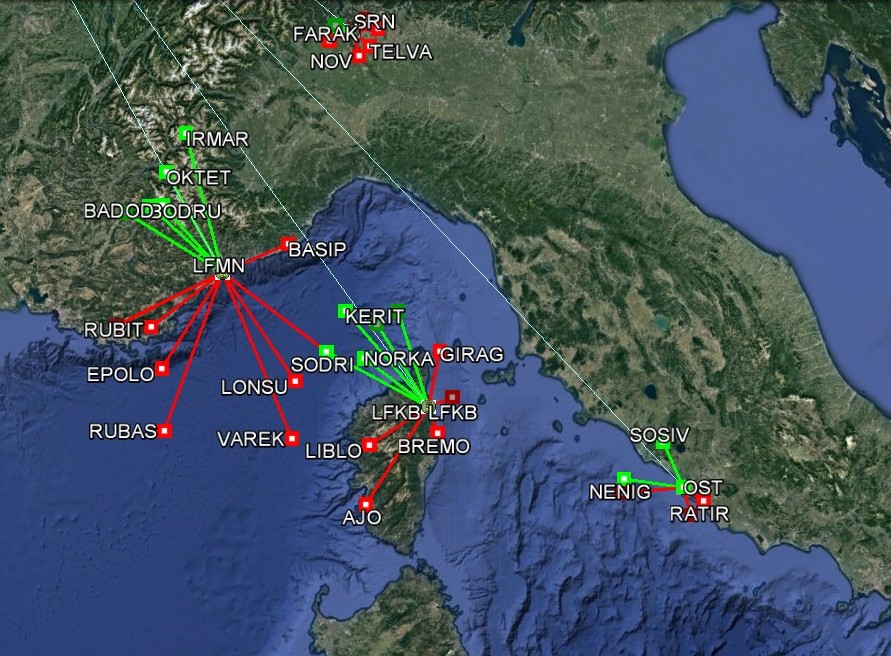
If you select before calculation the box "Google Earth File" you will have the result of what you did on google earth. (only the exit point is shown, the trajectory here is useless)
For the stars the idea is exactly the same... but we will keep only procedures passing over the airport in its way to the reference.
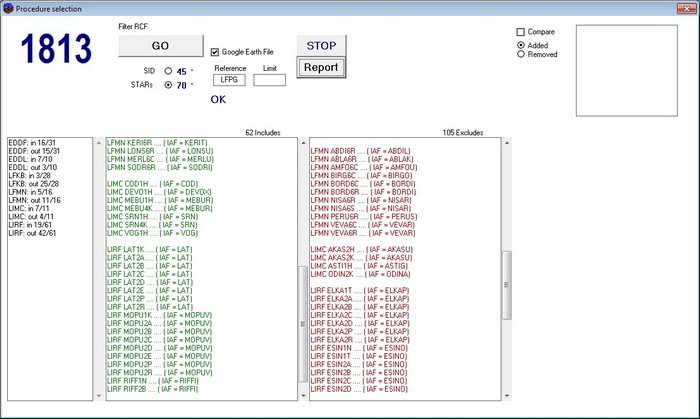
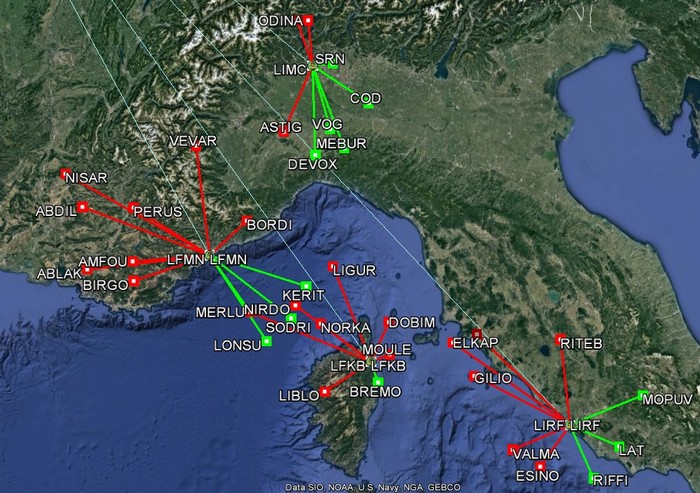
The gain in memory is important.
And it's easy to compare each cycle the job done to advise your database provider...
Internal viewer, (integrated map.)
According to the procedure or the points that are displayed with the internal viewer ...
The map appears with a movable tray icon:
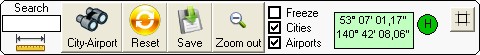
The search box allows you to search
a city or an airport in the world (by its ICAO code, or part of its name) then
press the button "City-Airport" or enter.
If only one result matche it will be drawn, if more you'll have a list.
Reset: At the 1st press = zoom to display all the elements called. 2nd press = removes lines and points recorded and resets the zoom to zero. (clear all)
Save: to print or save the image in JPG or BMP.
Zoom out: To "zoom out".
Freeze: for each new display no more refocuses the image nor the scales so that everything is visible.
Cities: Display or not the cities of the database.
Airports: Displays whether
the airports of the database (independent of the base file Arinc, the
updating is done manually, if necessary).
![]()
The circle gives the quality of map used files. B
Low Quality (Maximum Zoom) M for medium
and H for maximum
quality.
The map set H is not supplied as standard,
but you can download it from the "Configuration" module,
(It's free).
The right button displays or clears the latitude and longitude grid.
Button: ![]() allows the map to make measurements of direction (true and magnetic ) and distances.
Depending on the zoom line drawn on the map is blue and it is a rhumb line,
otherwise it is shaded orange and red and it is a great circle. Each segment
is of identical length.
allows the map to make measurements of direction (true and magnetic ) and distances.
Depending on the zoom line drawn on the map is blue and it is a rhumb line,
otherwise it is shaded orange and red and it is a great circle. Each segment
is of identical length.
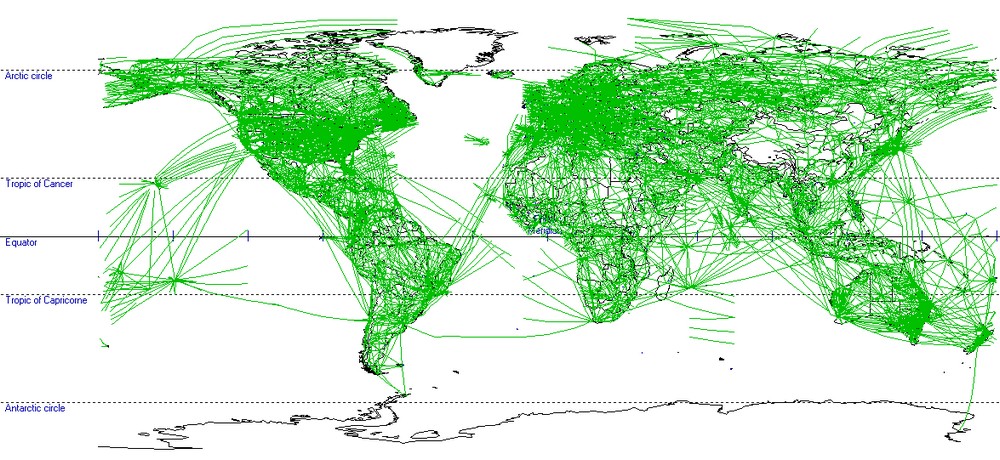
All distances displayed are always orthodromies. The courses are the courses
given for departure and arrivals if they differ by more than one degree (on
the great circle over long distances.)
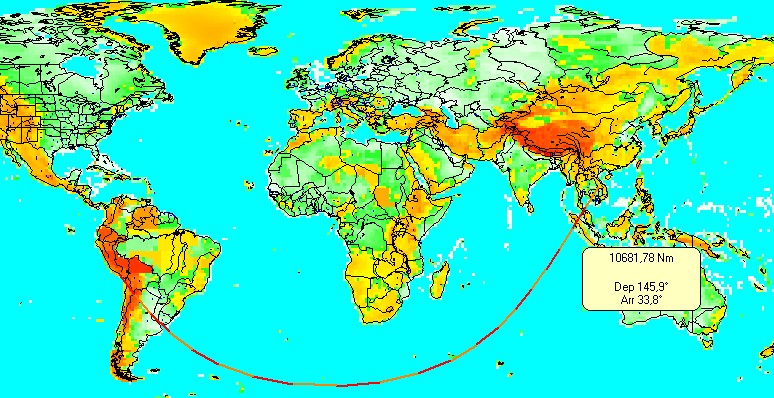
To go from Lima (approximately) to Ho Chi Minh City one must take an initial
heading of 146°, and travel 10,682 nautical miles. We arrive to the true
heading of 34° ...
When distances are small, the display is also in meters (measurement of length
of runways, for example.) The position in latitude and longitude of the cursor
is displayed in the green area on the right. The accuracy is higher (1/100 second)
when the grid is selected "X10" or "X100" in the menu: ![]() or
or
![]()
To move the module, click and drag in a free white zone of its area.
The map:
Is displayed by default with the major cities and the airports, but without terrain.
To zoom ... Click in one corner and drag to the opposite corner you want to see.
Right-click in the map will redraw it taking this point as its center.
Airports (ICAO Codes) Can
be easily updated.
Green, airports with the longuest runway is 2000 meters long or more.
Maroun: airports with runway between 1000 and 2000 meters.
Orange when the longuest runway is under 1000 meters.
example:
You can display only the ICAO code
or the code and the name of the airport.
You can hide the airports with runways shorters than 2000 m.
Boundaries islands, lakes are shown depending of the zoom. (and if you downloaded the files...)
The menu:
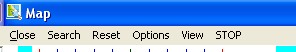
Close... Close the map
Search: To search a country and a city in the world
Reset: Will start a new map and completly erase the memory.
Open: Open: will open a kml file (google earth compatible file, created by another program, or this one)
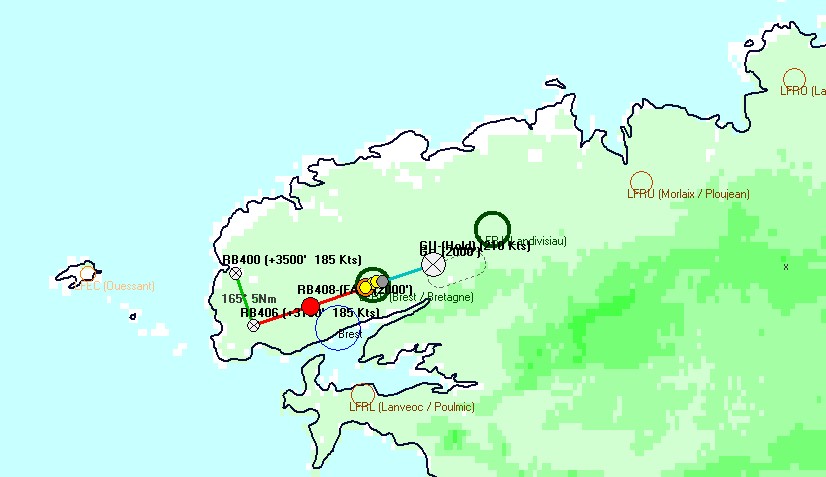
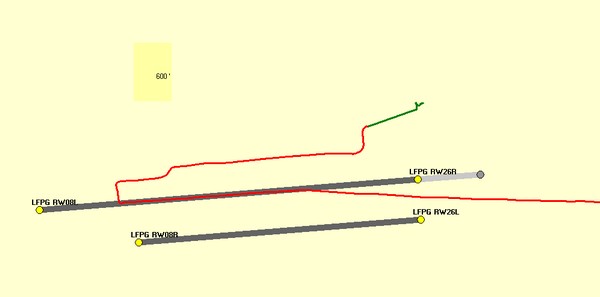
Example with this takeoff from Runway
08L at CDG (from Taxiway T5)
DOF: Opens the Digital Obstacles Files modules. (Follow the link to get all informations)
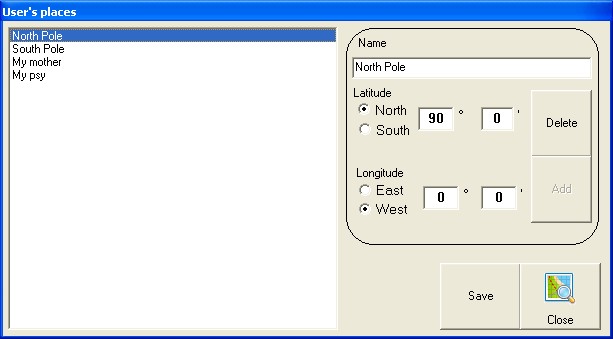
Maintain your places list: To manually add or remove a custom place.
View:
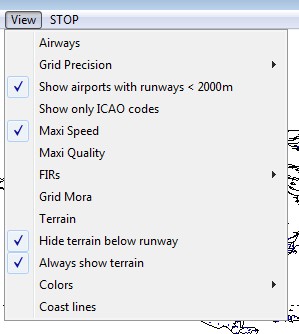
Airways: Mainly explained here.
Grid Precision: To obtain a bigger accuracy of the displayed coordinates.
Show airports with runways < 2000 m: will hide small fields for map clarity.
Show only ICAO code: For the same reasons. the all name of the airport is hidden and only is four letters code is showed. Actually, for the hi zoom level the name, if it's shown, is truncated when it's possible. (LFPG / Paris - Charles de Gaulle becomes, LFPG /Paris)
Maxi Speed: will accelerate the process. Terrain and maps will be at lower quality.
Maxi Quality: whatever is the zoom. Quality will always be at top... It will be hard to stop smocking while waiting for the map to be completed...
FIRs: To add on the map all differents Firs.
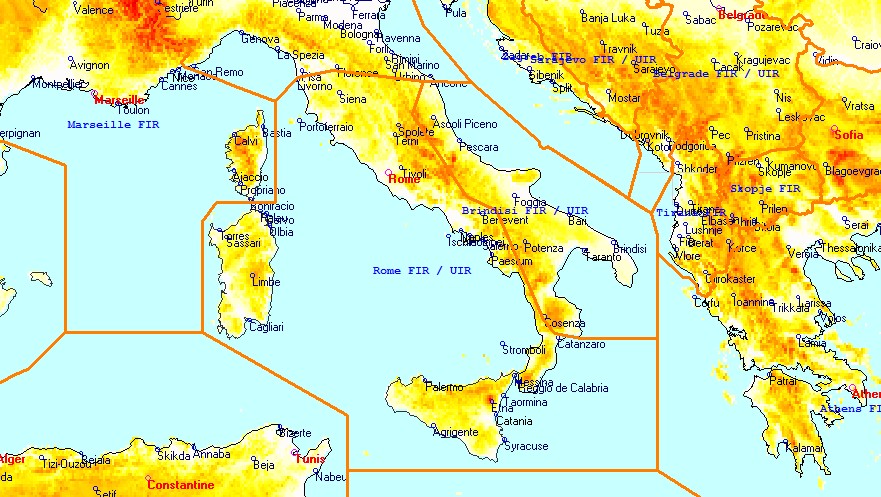
Grid MORA: To show or not the value of the grid Mora (minimum off route altitude) in the map. The color scale is on the left of the map. The mouse gives you the Mora value for each square degree
Terrain:
The terrain on the map is a great help. To show it you first have to go and download it (it's free) with this function. (XXXXX)
Hide terrain below runway:
If you are displaying a procedure of an airport, with option will show only the terrain that is dangerous for the flight.The map will be blank (white) for all zones where there's nothing above the field.
Example at SEQU (Quito): the airport is at 9228' and the runway 35 is at 9198'.
Showing the map and the terrain below will display this and selecting "hide terrain below" will show this:
Choose the display you prefer... remember that the colors will be different, but the scale on the left will always follow...
Always show terrain: means that what ever is the zoom you'll always see the terrain.
Colors:
Two possibilities exists. One with low levels Green then Yellow, Red and Black, the other with low levels Yellow then Red and Black. The problem of the first one is that it's not easy to imagine that the terrain is higher between a dark green and a light yellow. but the result is a bit more comfortable, design...
You'll make your choice (default is all yellow).
Coast Lines:
To show or not the lines of the map.
Left up corner, the scale.
![]()
Datas of the map comes from CIA World DataBank II.
Terrain datas are coming from:
http://www.cgiar-csi.org/data/srtm-90m-digital-elevation-database-v4-1
(They have been reworked)
If the step detailled here as been properlly done, and the file is generated, you'll have this link available.
To click on it opens this windows:
For each cycle you have done the file, it appears on your right in the list.
Select the good one.
Select High level, Low level, Both, or all (without distinction) and all airways
will be plotted on the map.
- You can ask for a limit in the
MTCAs of the legs
- You can force some characters in the name of the airway, or if you check "integral"
the complete name of the airway.
- You can ask to see only the airways containing one Fixe.
Example: I ask in spain all airways containing in their names "UN87":
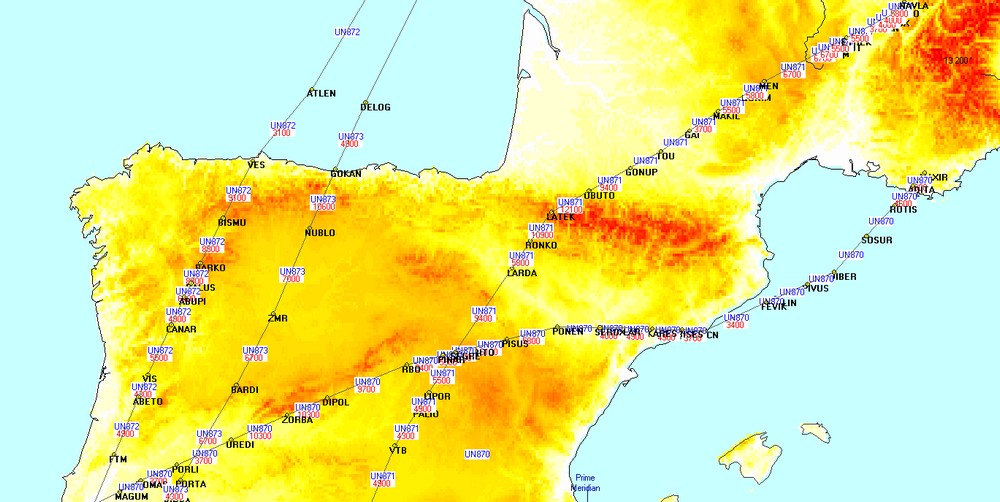
We have the MTCA computed, The fixes and the lines.
To compare with other cycle (file) you can change the color of drawing when selecting a file to plot. You'll see the differences:
If you draw all of them you'll have this, unreadable but lovely...
Airport Search:
Click on this button ![]() just right of the OACI textbox:
just right of the OACI textbox: ![]()
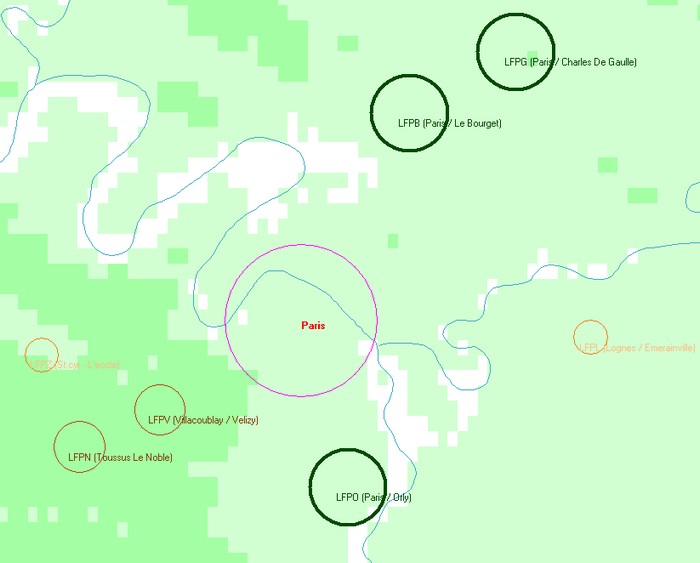
Example you search an airport, anywhere in the world, where the name of it's city contain "Paris"
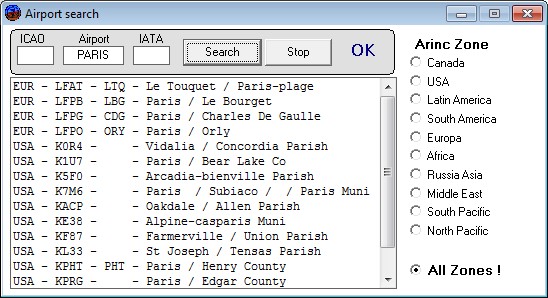
Clicking any line of the list will
charge the software with this airport.
You can use this module if you search an airport and you only know 2 letters
of its IATA code, or only 2 letters of the ICAO code...
Fixes research:
Click on![]() or in the waypoint/Navaids modules on the
or in the waypoint/Navaids modules on the 
This box will come.
Put in the navaid or waypoint ident , Eventually the Zone and Area to explore then "Search"
When it's done, OK is shown.
Example, the waypoint "VEDUS" Is used for Stars at LFPG / LFOB / LFPC
/ LFPT and in 3 airways of France.
If you click in any line you'll have this Airway / Procedure that will be shown.
All objects in a area:
You want to know all what is present in the square N22° E005°... (between N22 and N23 and E005 and E006)
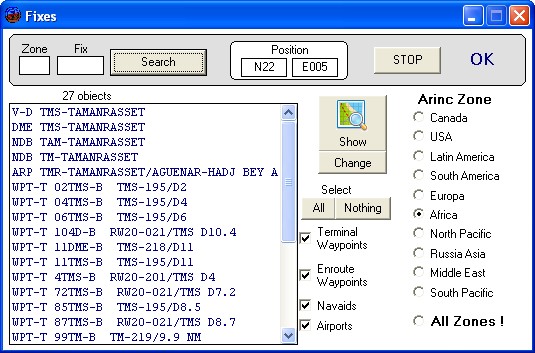
And whatever it is it will be in the list.
And on the map.
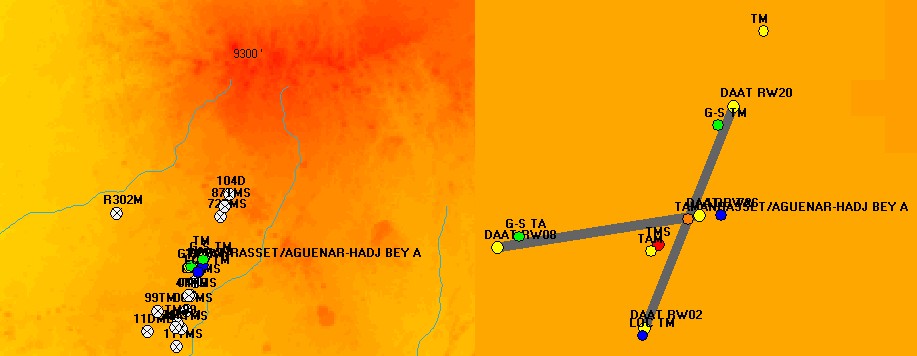
Very useful when one lokks for something and doesn't know exactly what nor exactly where...
When you ask for un Fix with its
position you have a little ![]() above.
above.
Clicking on it will load a new module. First fix on the left, secund one on
the right. Distances & bearings are automatically computed
Example, you want to know the distance
between the DME of the ILS of CALVI Rw 18 and the runway threshold...
Click in the compass above coordinates of runway 18 at Calvi.
And same above the DME of the ILS
(Module Navaid)
Where we confirm the radial (178°) and the distance (1.38 Nm) ... (Thus this explain the Bias of 1.2 Nm of this DME...)
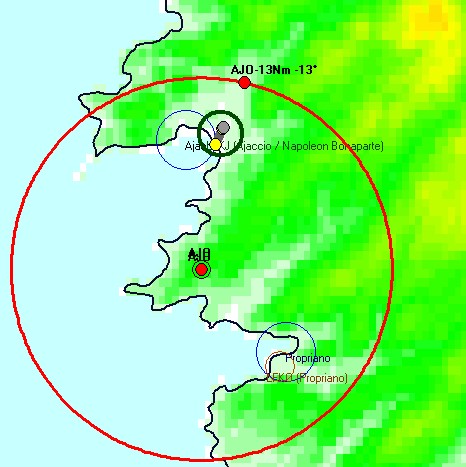
Radial - Distance from a fix:
If you want to plot a radial / distance from a fix you'll do that with this same module...
Example, 13 Nm of AJO in the radial 12°mag (Final fix of the Rw20 at Ajaccio)
Mag Var at AJO is of 1°E so Track is 13°.... Coordinates are shown on the right...
And here it is....:
Circles of distances:
Thanks to buttons ![]() One can show a circle of any radius around any of those fixes.
One can show a circle of any radius around any of those fixes.
Circle of 13Nm arround AJO is like that...
Statistics:
From the configuration module, a hidden button... because you won't use it every days:
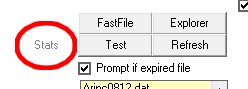
Then select the file you want to study...
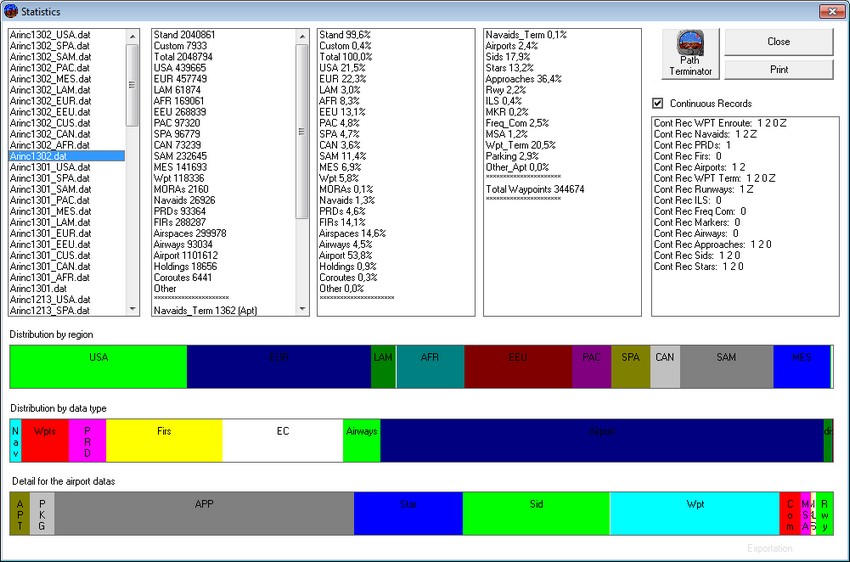
The button "Path terminator"
 will give you
the way to determine the successions of path terminators in the codings of Sids
Stars or approaches of your database.
will give you
the way to determine the successions of path terminators in the codings of Sids
Stars or approaches of your database.
Example: I have 589 approaches with a CA then a CI...
(Clic in the line and you open the procedure)
Start with an example... you want a list of all airports of France, sorted by the length of the longuest runway !
Easy...
When you have your 339 airports in the list you push on the button "Arinc Coding"
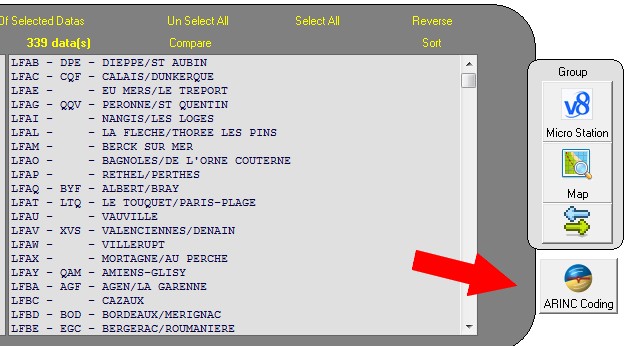
The list of all Arinc lines arrives:
press on the button :
![]()
And say yes at the question, "Do you want to create an Excel File ?" (indeed, it's not an excel file, it's a CSV file that can be open with any spreadsheet application.)
This module opens:
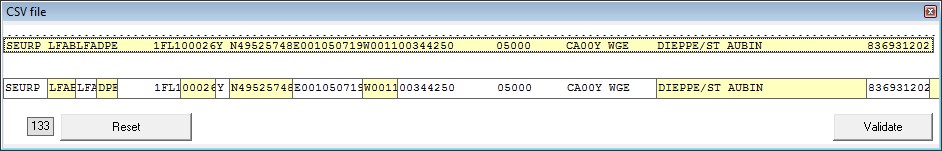
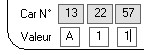
You clic to make the separations where you want to separate the values.
Here I made a selection of ICAO code / IATA code / Longuest runway / Latitude / Longitude / Mag Var / Airport full name.
Click on Validate and... in you spreadsheet, remove the undesirables columns, make the sort order and... 10 seconds after...
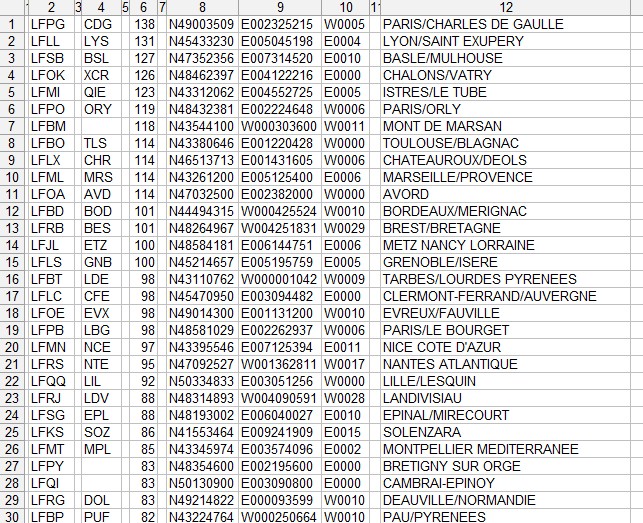
Your file can contain some informations customized from your company.

Select "Tailored"
A new module opens
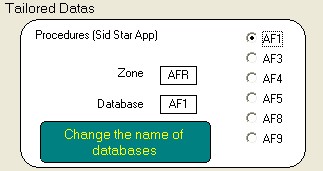
Select your database, and your zone.
To see your coroutes, press. ![]()
Lists will be fill up:
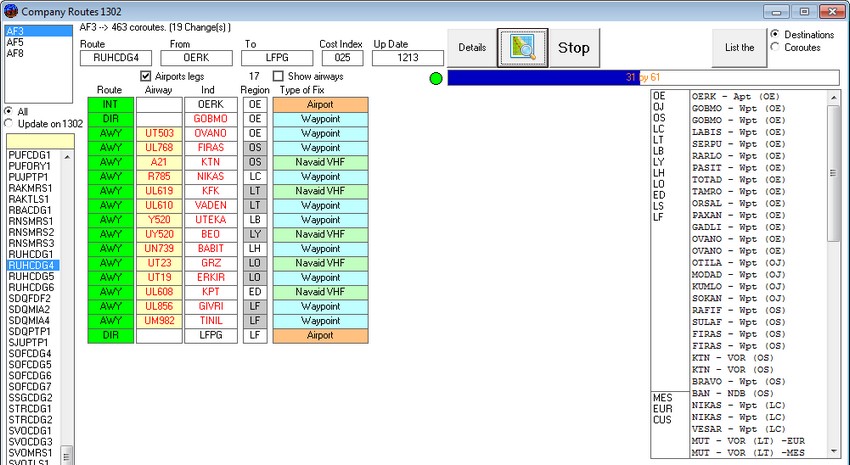
Select the database for the coroute you want. Here, in A320, the route RUH--> CDG number 4.
The datas of the route are shown, you can click in an airway to see the fixes overflied. (in the example, on the UN739, fixes between BEO and BABIT)
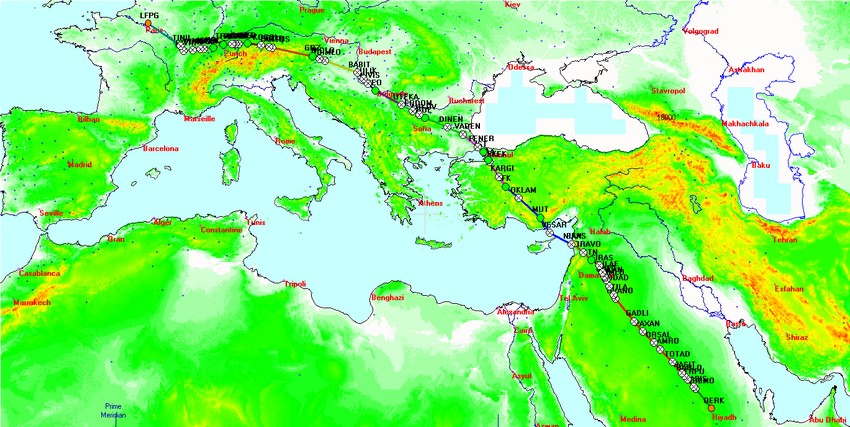
As usual, you can display all the route on the map or in google earth.
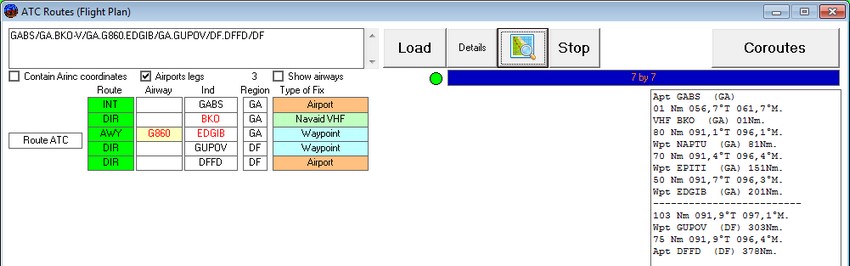
Button: ![]() You
have a flight plan, an atc routing, and you want to know:
You
have a flight plan, an atc routing, and you want to know:
1) Wich fixes will be overfly.
2) Above wich regions and countries... (In which FIR, do I have overfly authorizations, etc.)
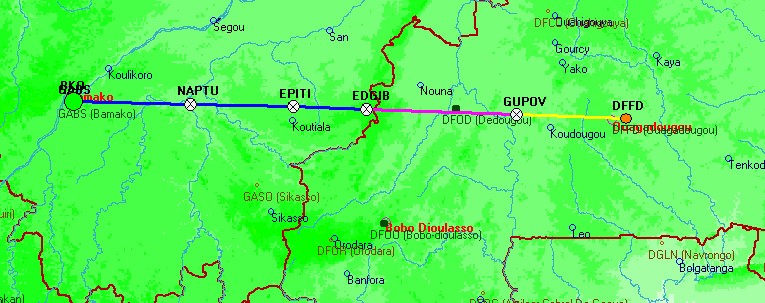
Example: from Bamako to Ouagadougou:
| GABS.BKO.G860.EDGIB.GUPOV.DFFD |
This same route can have the format:
| GABS/GA.BKO-V/GA.G860.EDGIB/GA.GUPOV/DF.DFFD/DF |
You paste in the window and press
"LOAD" and
or
After a time, when the program knows everything...
After displaying a standard procedure (Approach, Sid or Star) you press the button "Save"
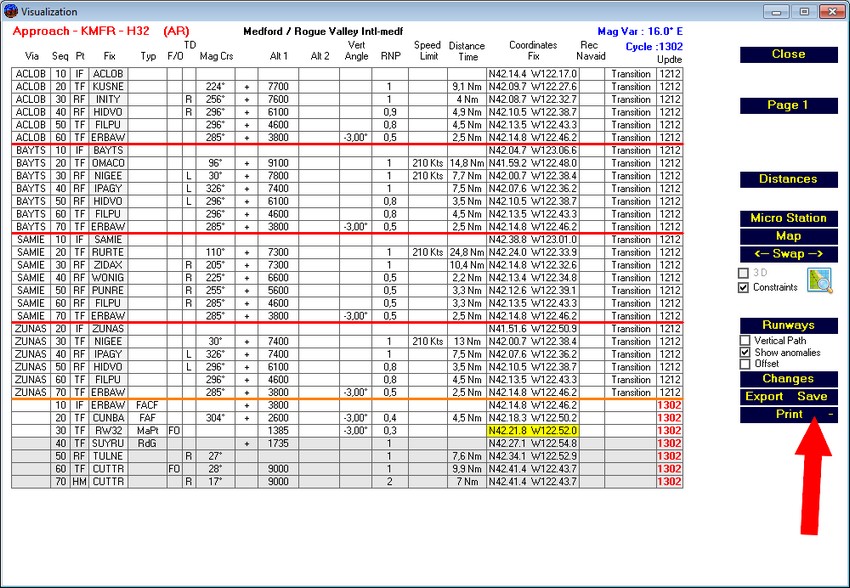
With the button ![]() you
open a new module that gives you immediatly in Arinc 424 your procedure you
can play with.
you
open a new module that gives you immediatly in Arinc 424 your procedure you
can play with.
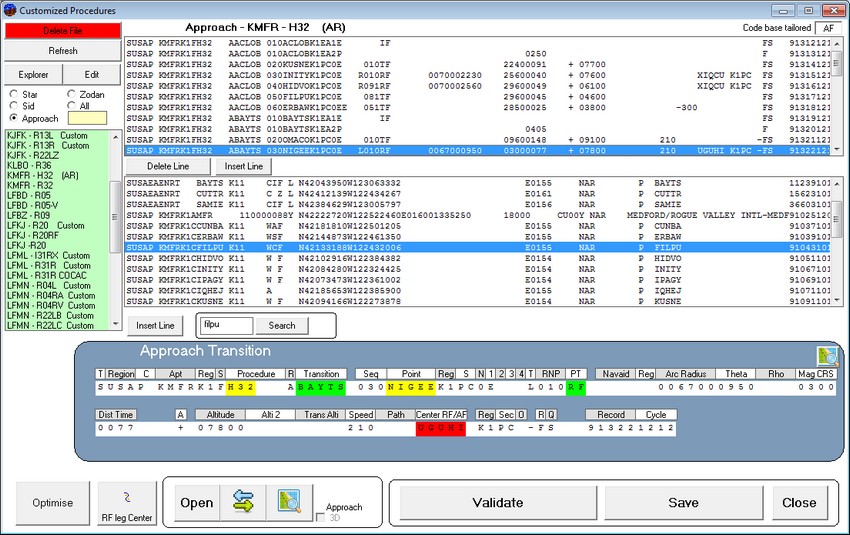
All is modifiable, let a blank when no info is needed. You can also clic in the description and enter the data in the popup boxe, just taking care of the numbers of characters.
The upper list is the terms of the procedure, the bottom one is for the fixes.
You can also create your PRD zones, and test them.
Important, you can play as you want with this function, you will never alter your main file, only you'll create some .cus files. (So, don't hesitate, you'll see how it's funny)
The button "RF leg Center" will open the module that allows you to determine the point "ARC" of a RF leg:
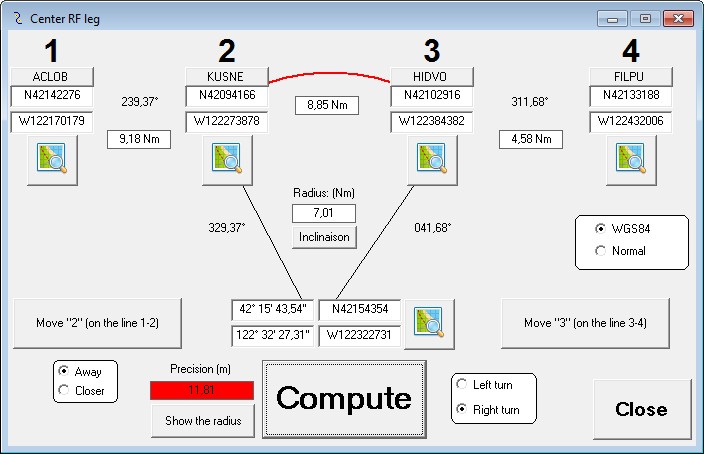
If the "Compute" button gives a low accuracy (here, the lines crosses with 7.515 meters) that says that the points of end and start of turns are misplaced. there's no possibility for the trajectory to have a circle with an unique center. You can move the point of your choice to recompute.
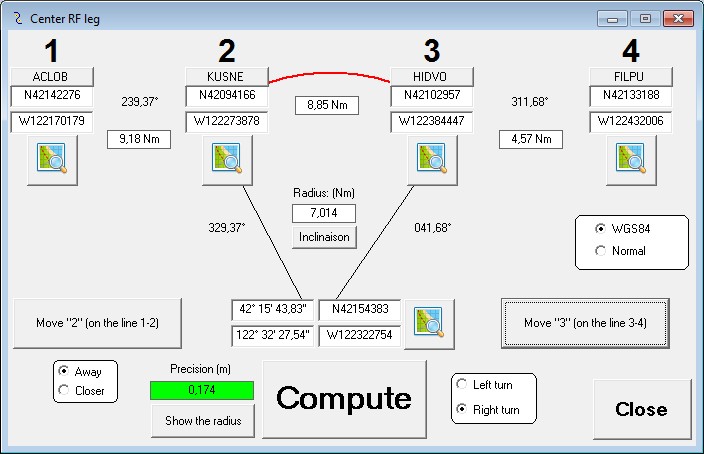
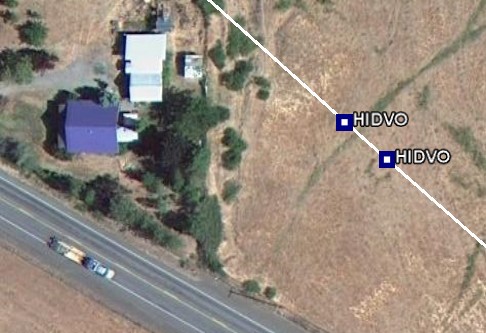
When you are less of one meter (here, 17 centimeters*) the point HIDVO is correctly positioned and you are done.
*(The maximal definition of Arinc424 position is 1/100 of secund... 1852/(60 x100) = 30.86 centimeters at the equator.)
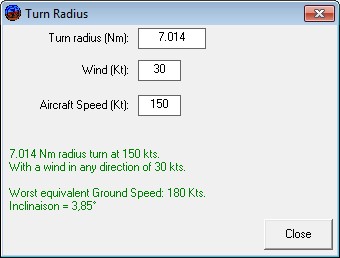
The button "Inclinaison" will give you the max roll angle in the turn, input are Ground speed and turn radius..
At the first stop
of the program, when it's the first time you open a file.
You will have this window that shows. For about 2 minutes. It's normal.
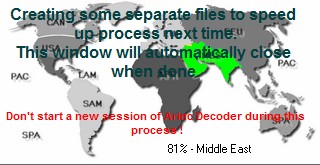
After this process each region will
have its proper file and all action will be 10 time faster
List of Arinc Decoder Versions:
|
1.0
|
First release,limited to PRDs zones. |
|
2.0
|
Airport informations added. |
|
3.0
|
Waypoints / Navaids informations added |
|
3.1
|
Airways and Procedures table information added |
|
3.2
|
Internal Viewer. |
|
3.4
|
Procedures viewer, FIRs added. |
|
3.5
|
Manual coding possibilities /Procedures exportation. |
|
3.6
|
Excel exportation added |
|
3.7
|
Airspaces added / Comparaisons between cycles. |
|
3.8
|
Coroutes and ATC routes. |
|
3.9
|
Worldwide terrain information added in viewer. |
|
4.0
|
Procedures viewer improvements. External version released (Not only Air France) |
|
4.1
|
Full English translation |
|
4.1.5
|
Table & Descent |
|
4.1.6
|
Table & Descent adjsusted for Biased DME |
|
4.1.8
|
Improved SIDs display |
|
4.1.9
|
Improved MagVar consideration in final procedure |
|
4.1.11
|
Improved OEB42 (Thales Issue) airlines exportations |
|
4.1.12
|
Distances of Internal Map |
|
4.1.13
|
Large screen acceptation for Internal Map |
|
4.1.14
|
Map definition recording function + Font problem debugging. |
|
4.1.17
|
Compatible with Lido new format. |
|
4.1.18
|
New module for DOF (Obstacles) files of USA. |
|
4.1.19
|
KML file reading improvement. |
|
4.2
|
MTCA Calculations & module |
|
4.2.1
|
Integration of the CIFP (Coded Instrument Flight Procedure of the FAA) |
|
4.2.12
|
AutoAdjust function + minor bugs removal. |
|
4.2.13
|
TakeOff Path modifications. |
|
4.2.15
|
Small ameliorations. |
|
4.2.18
|
Lido Flight Import available. |
|
4.2.22
|
Take off path with complex trajectories for PEP software |
|
4.2.25
|
FIR updating for the internal map |
|
4.2.28
|
Procedure distances exportation for flight support |
|
4.2.29
|
Approache table of descent amelioration |
|
4.3
|
Many implementations for Lido-Flight users and airlines |
|
4.3.9
|
New module for runway threshold comparison |
|
4.3.10
|
SBAS LPV approaches capabilities to open and plot. |
| 4.3.13 | Add of DF without turn direction in app verif batch. |
| 4.3.14 | Add of new Thales bug in app verif batch |
| 4.3.17 | KMZ file opening capability in the map |
| 4.3.18 | Approaches, Sids & Stars checking possibility. |
| 4.3.19 | New module in route catalog for overflight rights. |
| 4.3.20 | Bug fixed in vertical profile of ILS approaches. |
| 4.3.30 | Xml files for lido eRM |
| 4.4 | Double RF in procedure conception |
| 4.5 | Module for SID/STAR optimization, Aircraft database reduction depending of the flights direction. |
| 4.6 | RNP AR automatization of analisys and checking. |
| 4.6.5 | Determination of airport mask angle for RAIM Outage prediction. |
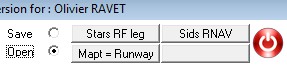
| 4.7 | optimization of a new module for procedure (SID STAR Approach) conception and verification. |
If you have a license and your version is oldest than the last one, contact me as soon as possible to obtain a link of the last version. A license includes the updatings...
Contact:
This software has been performed
in Visual Basic 6 by
Olivier RAVET.
If you are interested, please note that you need to be the owner of an Arinc dataset (AEG, Lido, Jeppesen, NavTech or any other CIFP )(wich are now free) and then you can contact me to get a demo copy, here: